

HOOPS AI: Encoder Module
BrepEncoder
The BrepEncoder class is responsible for computing and persisting geometry and topology data from a B-rep. It provides methods (called “push” methods) that extract specific features from the model and if the DataStorage object is provided, it can storage it in a compressed optimal file. Very handy when working with large datasets.
[1]:
from scripts.helper_tutorials import load_environement_variables

load_environement_variables()
[2]:
import hoops_ai
import os
import sys

license_key = os.environ.get("HOOPS_AI_LICENSE")
if not license_key:
    sys.exit("HOOPS_AI_LICENSE environment variable is required.")

hoops_ai.set_license(license_key, validate=True)
------------------------------------------------------------
HOOPS AI
------------------------------------------------------------
  Platform      : Linux 6.17.0-29-generic
  Architecture  : x86_64
  Python        : 3.12.3
------------------------------------------------------------
  Core          : hoops-ai             1.1.0
  CAD Access    : hoops-exchange       26.2.0.dev7  (build: 1e11169 2026-03-23T17:47:19Z)
  Conversion    : hoops-converter      26.1.0.dev8  (build: 876a4c1 2026-05-25T07:03:01Z)
  Insights      : hoops-web-viewer     26.1.0.dev6  (build: 111330c 2026-05-26T11:15:51Z)
------------------------------------------------------------
======================================================================
[OK] HOOPS AI License: Valid
======================================================================
View your cad model in the notebook
[3]:
import pathlib
#TEST CAD FILE
cad_filename = pathlib.Path.cwd().parent.joinpath("packages", "cadfiles", "pn_verschr_r1.prt.1")


from hoops_ai.insights import CADViewer
import pathlib

output_dir =   pathlib.Path.cwd().joinpath("out")
if not output_dir.exists():
    os.makedirs(output_dir)


viewer = CADViewer(static_folder=output_dir)
viewer.load_cad_file(cad_filename)
[3]:
True
[4]:
viewer.show()
status = viewer.get_status()
print(f"Viewer is running on port: {status['port']}")
print(f"Viewer URL: {status['viewer_url']}")
Viewer is running on port: 8001
Viewer URL: http://127.0.0.1:8001
Initialize the HOOPSLoader and set the BRep options
[5]:
from hoops_ai.cadaccess import HOOPSLoader, HOOPSModel, HOOPSTools
[6]:
# open the cad file
cad_loader =  HOOPSLoader()
cad_model = cad_loader.create_from_file(str(cad_filename))

# Adapt to extract BRep information
hoopstools  = HOOPSTools()
hoopstools.adapt_brep(cad_model)
BRep data as numerical features for ML
[7]:
from hoops_ai.cadencoder import BrepEncoder

brep_encoder = BrepEncoder(cad_model.get_brep())
Encoding the Topology
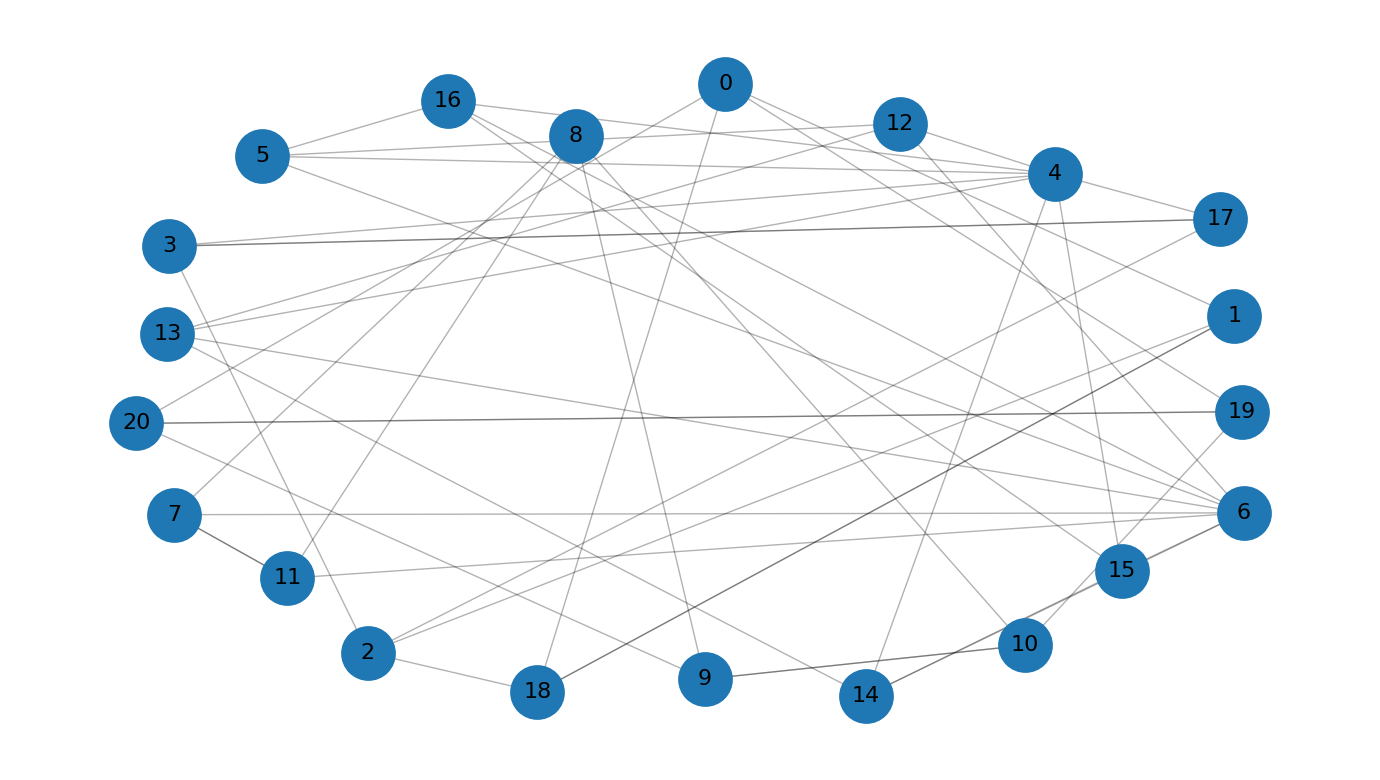
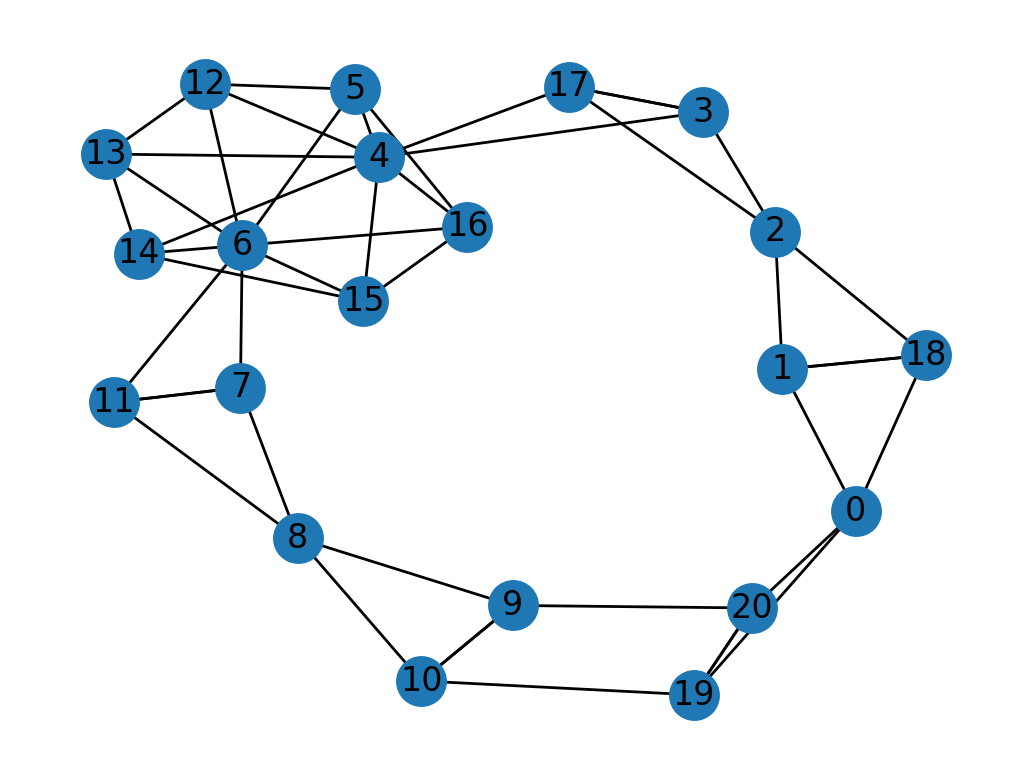
push_face_adjacency_graph() -> nx.Graph
Builds and stores a face adjacency graph from the B-rep model. This graph represents the topology of the model where nodes are faces and edges connect adjacent faces.
[8]:
adj_graph = brep_encoder.push_face_adjacency_graph()
print(adj_graph)
DiGraph with 21 nodes and 46 edges
[9]:
import matplotlib_inline
matplotlib_inline.backend_inline.set_matplotlib_formats("retina")

import networkx as nx
import matplotlib.pyplot as plt

pos = nx.kamada_kawai_layout(adj_graph)
nx.draw_networkx(adj_graph, pos, arrows=False)   # draw nodes, edges, labels
plt.axis('off')                         # turn off axes for clarity
plt.show()
[10]:
import networkx as nx
import matplotlib.pyplot as plt
import numpy as np

G = adj_graph
n = G.number_of_nodes()

pos = nx.spring_layout(adj_graph, k=10.0, seed=42)

nodes = list(G.nodes())  # order used for coloring
to01 = lambda rgb: tuple(c/255 for c in rgb)


plt.figure(figsize=(7, 4))
nx.draw_networkx_edges(G, pos, width=0.5, alpha=0.3, arrows=False)
nx.draw_networkx_nodes(G, pos, node_size=350)
nx.draw_networkx_labels(G, pos, labels={n: str(n) for n in nodes}, font_size=8)

plt.axis("off")
plt.tight_layout()
plt.show()
[11]:
face_index = 9
neighbor_faces = set(adj_graph.successors(face_index)) | set(adj_graph.predecessors(face_index))

print(neighbor_faces)
{8, 10, 20}
[12]:
viewer.set_face_color([9], [255,0,0])
[13]:
viewer.set_face_color(neighbor_faces, [155,155,0])
[14]:
viewer.clear_face_colors()
[15]:
# INTERACTIVE Get the face indices you selected interactively
selected_faces = viewer.get_selected_faces()

print(f"You selected {len(selected_faces)} faces: {selected_faces}")
You selected 0 faces: []
[16]:
# Highlight selected faces with a custom green color
viewer.set_face_color(selected_faces, [150, 255, 100])
Utilities for quick visualization using repo scripts folder
[17]:
from scripts import helper_tutorials
[18]:
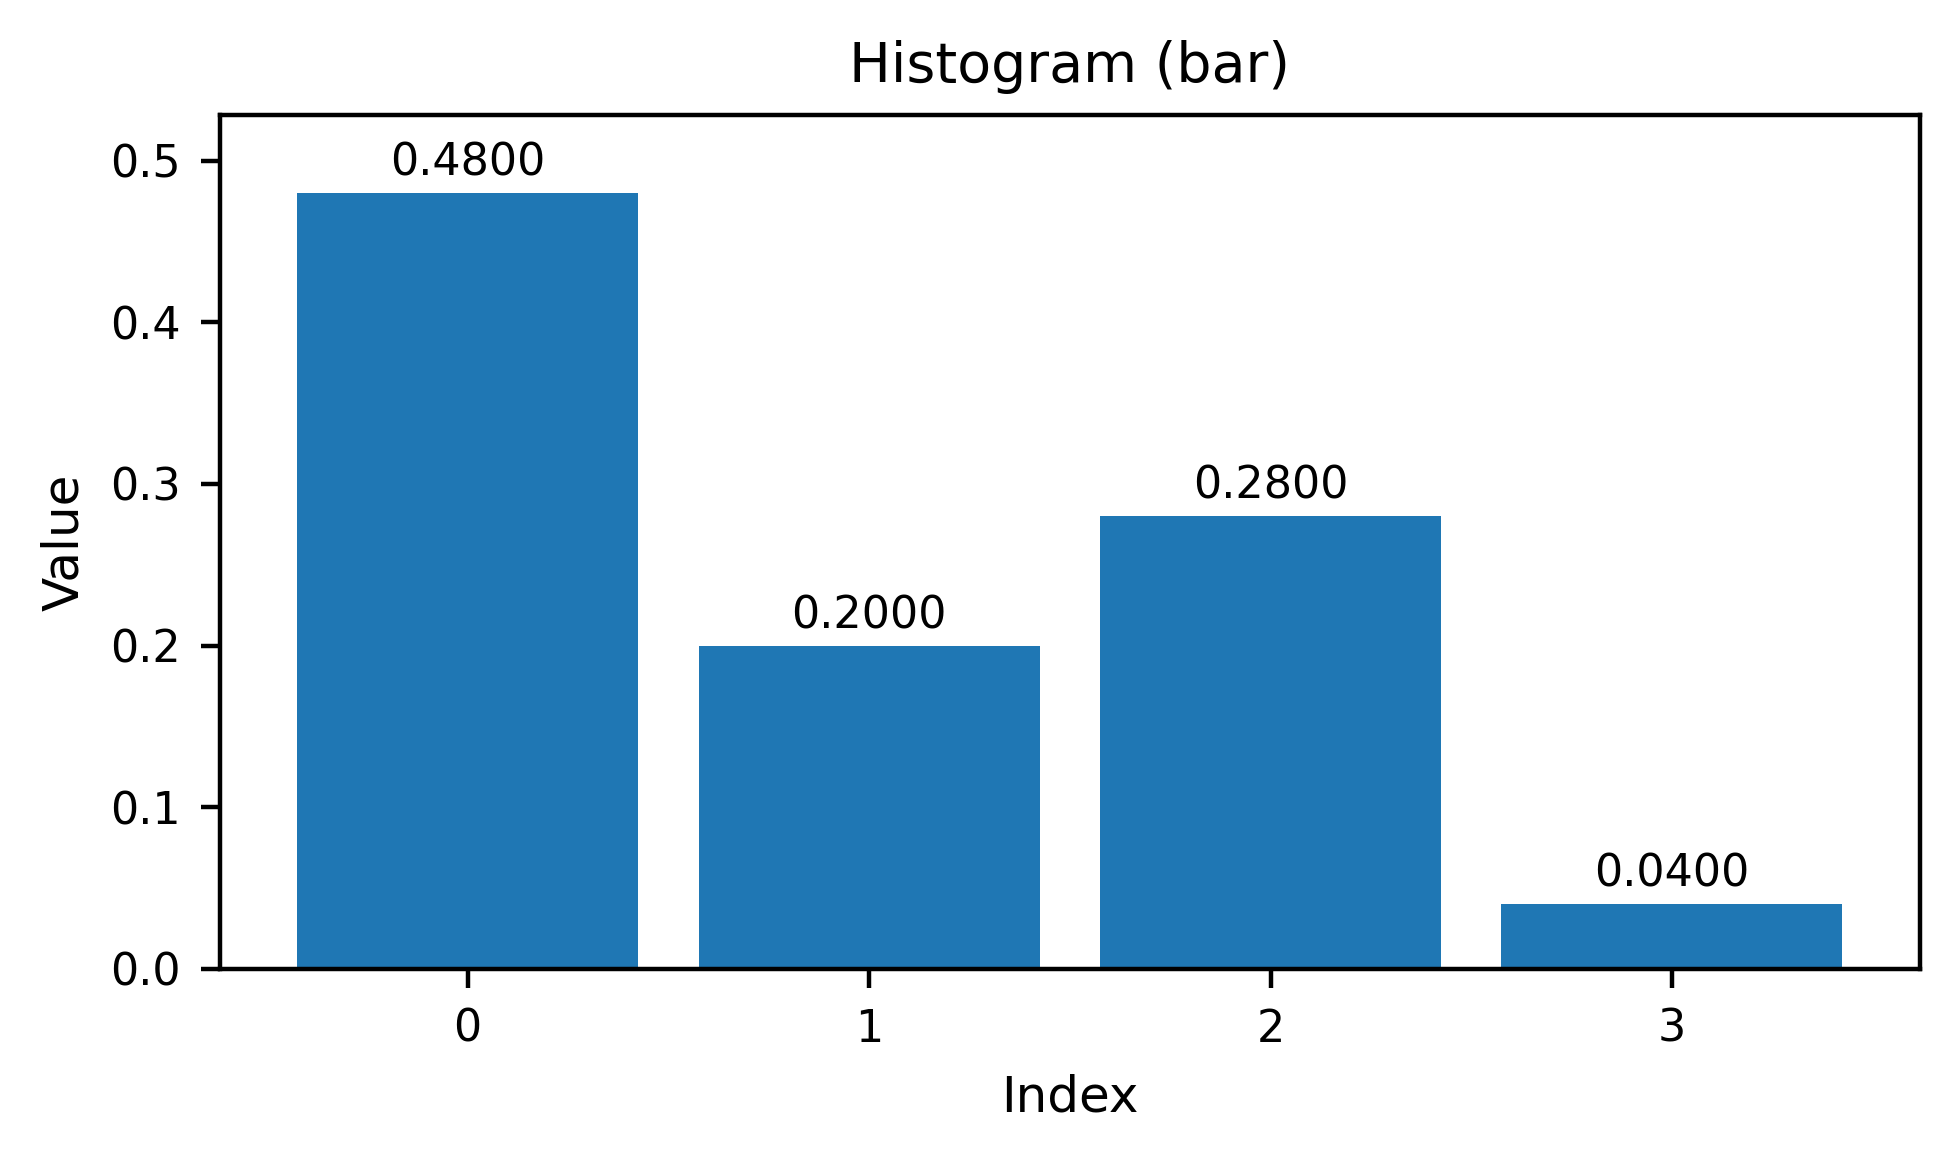
avg_distance = brep_encoder.push_average_face_pair_distance_histograms(10,5)
#print(avg_distance)
[19]:
helper_tutorials.plot_bar(avg_distance[15,10]) #[15,10]

[19]:
(<Figure size 1000x600 with 1 Axes>,
 <Axes: title={'center': 'Histogram (bar)'}, xlabel='Index', ylabel='Value'>)
[20]:
avg_angles = brep_encoder.push_average_face_pair_angle_histograms(10,4)
helper_tutorials.plot_bar(avg_angles[15,10])
[20]:
(<Figure size 1000x600 with 1 Axes>,
 <Axes: title={'center': 'Histogram (bar)'}, xlabel='Index', ylabel='Value'>)
Encoding the Geometry
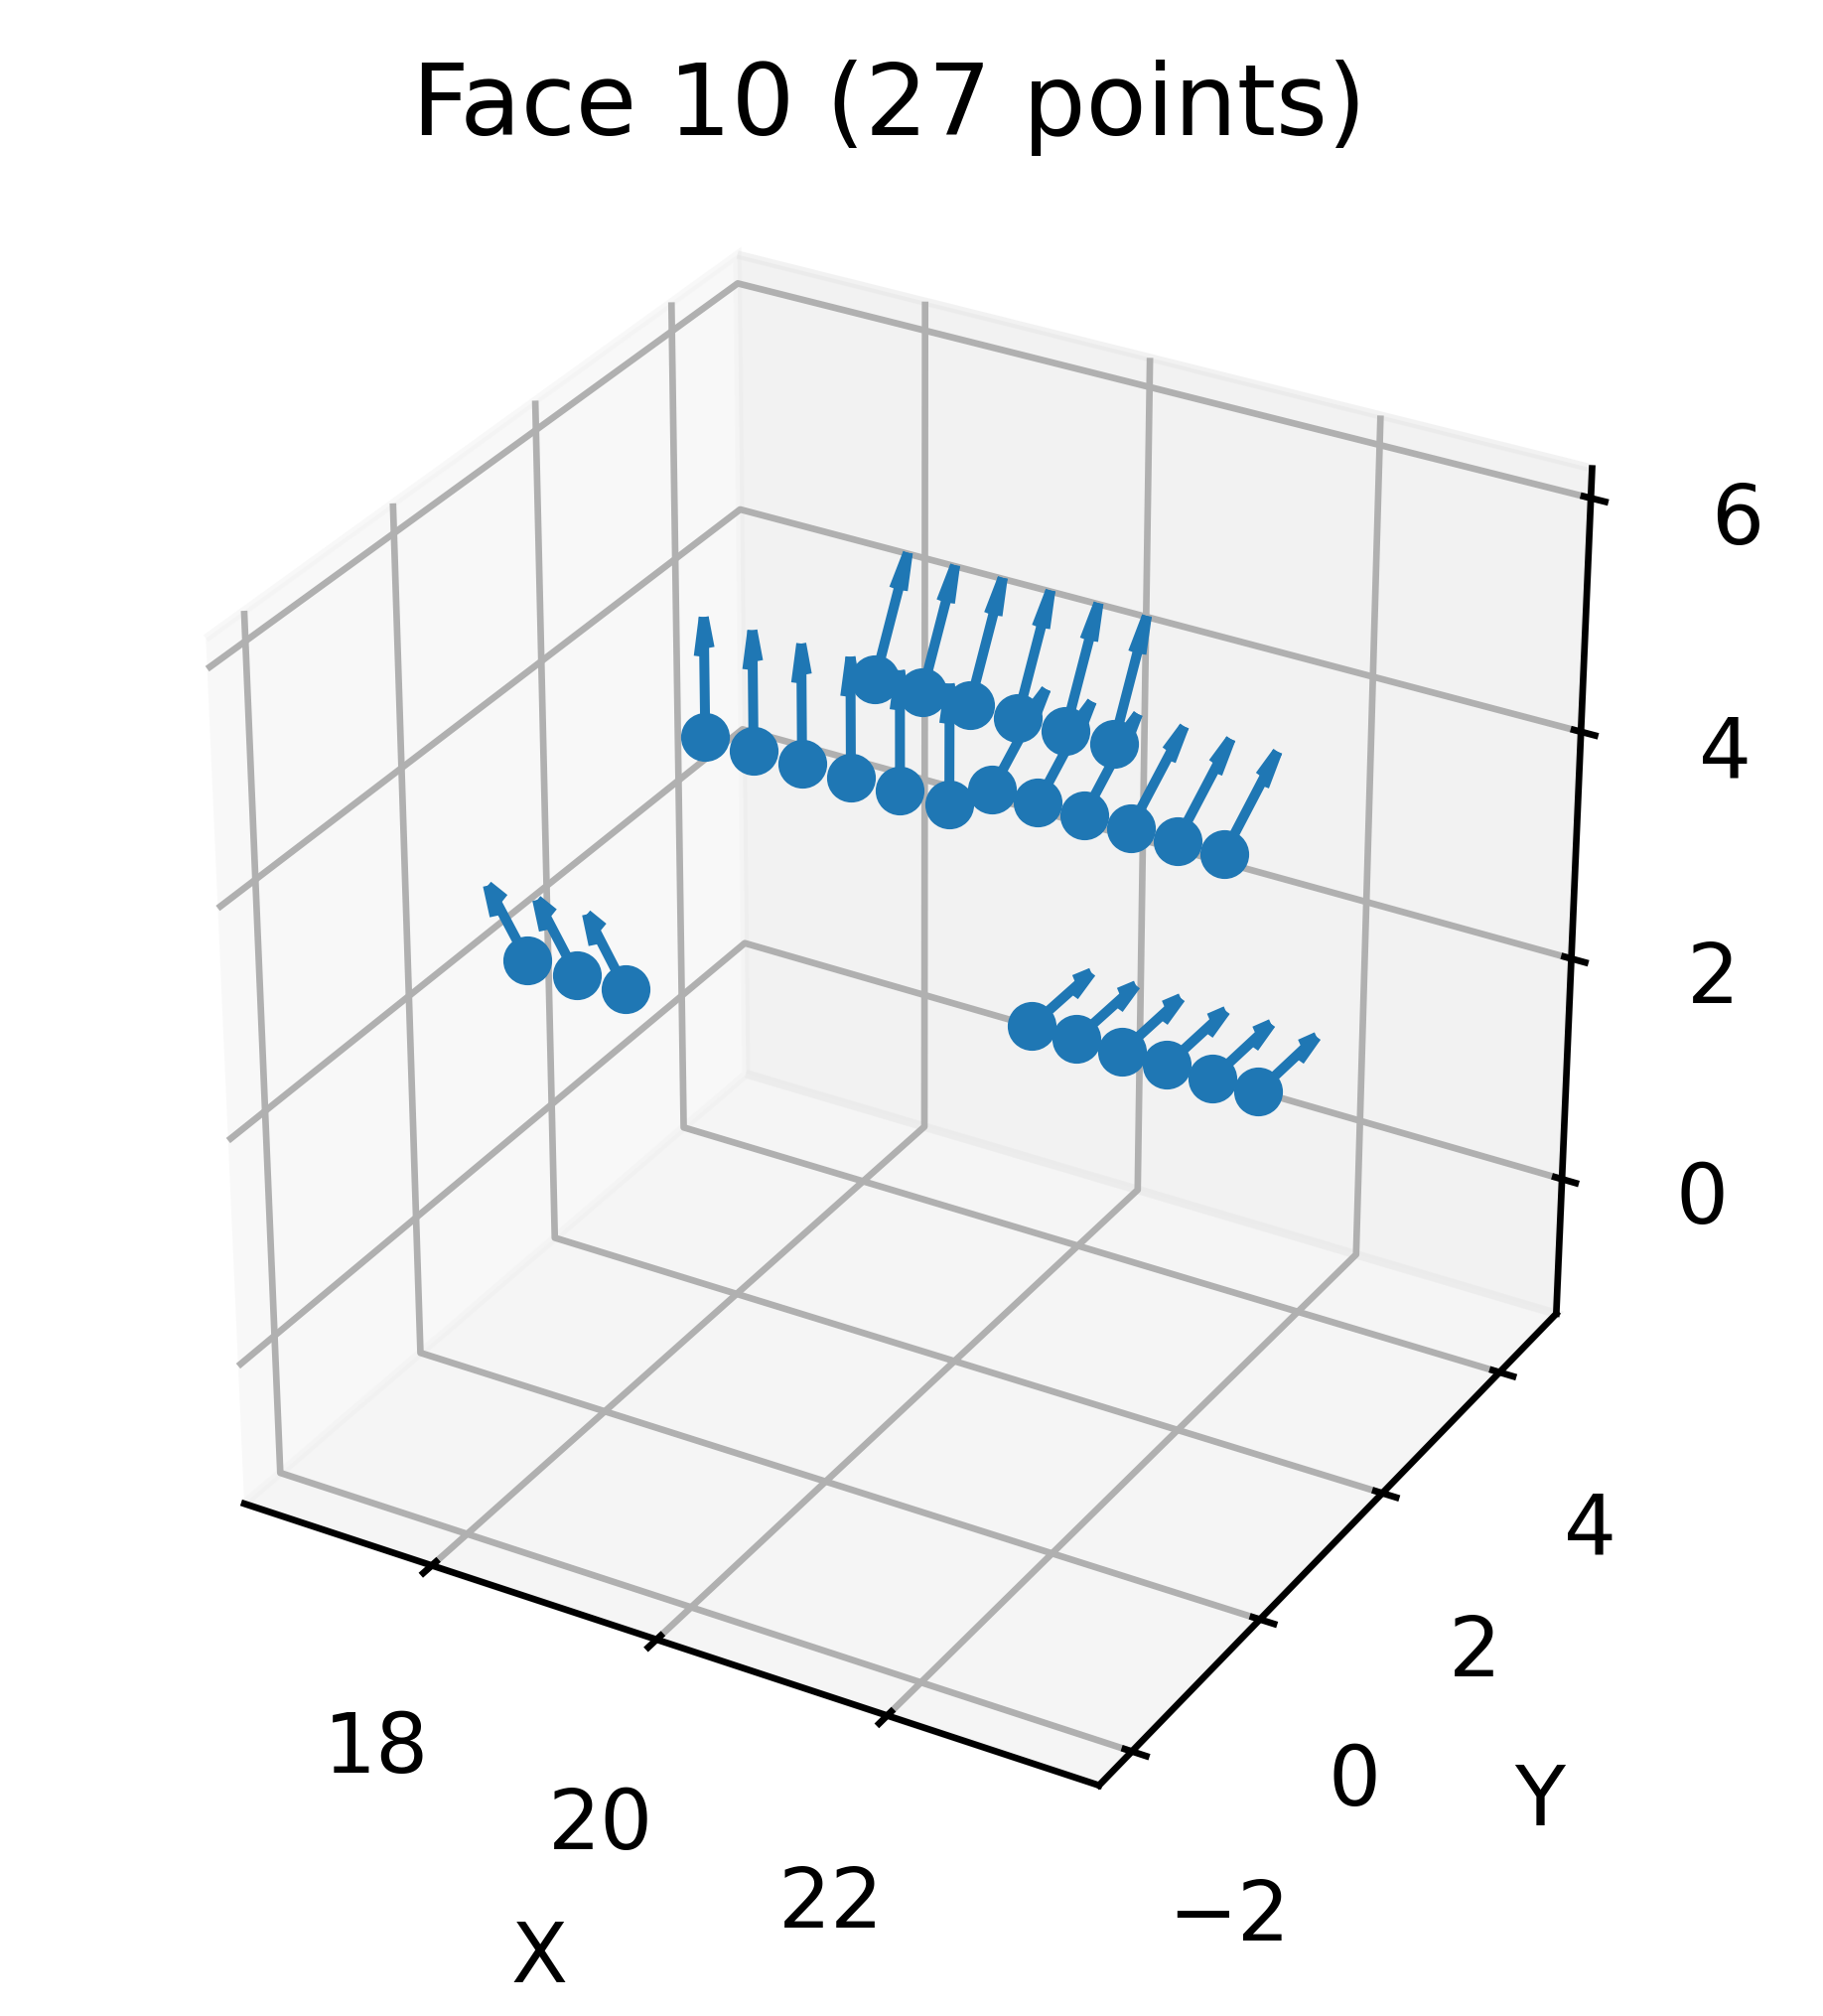
Samples points, normals, and inside/outside information on a discretized grid across each face.
[21]:
face_discretization = brep_encoder.push_face_discretization(pointsamples=27)  # 16 sample points per face
print("face_discretization\n", face_discretization.shape)
face_discretization
 (21, 27, 7)
[22]:
print(face_discretization[0][0])
[22.         4.500492   4.5229044  1.         0.         0.
  0.       ]
[23]:
viewer.clear_face_colors()
use_face_index = 10

viewer.set_face_color([use_face_index], [255, 0, 0])
helper_tutorials.plot_face_points(face_discretization, face_idx=use_face_index, show_normals=True, connect=False)
[23]:
(<Figure size 1200x900 with 1 Axes>,
 <Axes3D: title={'center': 'Face 10 (27 points)'}, xlabel='X', ylabel='Y', zlabel='Z'>)
[ ]:
Samples points along edges at regular intervals.
Parameters:
ugrid: Number of sample points along each edge (default: 5)
Returns: 0 on success
Storage Format: edgecount—ugrid—feature_dim numpy array of sampled data
[24]:
edge_discretization = brep_encoder.push_curvegrid(5)
print("edge_discretization\n", edge_discretization.shape)
print(edge_discretization[0])
edge_discretization
 (46, 5, 6)
[[ 2.2000000e+01  4.2797542e+00 -1.3905765e+00  0.0000000e+00
  -3.0901700e-01 -9.5105654e-01]
 [ 2.2000000e+01  2.6450336e+00 -3.6405764e+00  0.0000000e+00
  -8.0901700e-01 -5.8778524e-01]
 [ 2.2000000e+01  7.1669694e-15 -4.5000000e+00  0.0000000e+00
  -1.0000000e+00 -1.5926599e-15]
 [ 2.2000000e+01 -2.6450336e+00 -3.6405764e+00  0.0000000e+00
  -8.0901700e-01  5.8778524e-01]
 [ 2.2000000e+01 -4.2797542e+00 -1.3905765e+00  0.0000000e+00
  -3.0901700e-01  9.5105654e-01]]
Extracts and stores various face attributes, including face types, areas, and loop counts.
Encoding the attributes
[25]:
[face_types, face_areas, face_centroids, face_loops], face_types_descr = brep_encoder.push_face_attributes()
print("face_types", face_types)
print("face_areas", face_areas)
print("face_loops", face_loops)
print("face_types_descr", face_types_descr)
face_types [0 1 0 1 0 0 0 1 0 1 1 1 0 0 0 0 0 1 1 2 2]
face_areas [ 43.911655 141.3149    75.277115  51.831074  24.732485  57.030937
  19.963306  12.871587  28.228918  39.265965  39.265965  12.871587
  57.030937  57.030933  57.030937  57.030937  57.030933  51.831074
 141.3149    10.575602  10.575602]
face_loops [2 1 2 1 2 1 2 1 2 1 1 1 1 1 1 1 1 1 1 1 1]
face_types_descr {0: 'Plane', 1: 'Cylinder', 2: 'Cone'}
Extracts and stores various edge attributes, including edge types, lengths, dihedral angles, and convexities.
Storage Keys: “edge_types”, “edge_lengths”, “edge_dihedral_angles”, “edge_convexities”, and metadata “descriptions/edge_types”
Storage Format: 1D numpy arrays for each attribute type
[26]:
[edge_types_np, edge_lengths_np, edge_dihedrals_np, edge_convexities_np], edge_type_descrip = brep_encoder.push_edge_attributes()
print("edge_types_np", edge_types_np)
print("edge_lengths_np", edge_lengths_np)
print("edge_dihedrals_np", edge_dihedrals_np)
print("edge_convexities_np", edge_convexities_np)
print("edge_type_descrip", edge_type_descrip)
edge_types_np [1 1 1 1 0 1 0 1 1 1 0 0 1 1 0 0 0 0 0 0 0 0 0 0 0 0 0 0 1 1 0 1 0 1 1 1 0
 0 1 1 0 0 0 0 0 0]
edge_lengths_np [14.137167   14.137167    7.8539815   7.8539815  18.          7.8539815
 18.         17.278759   17.278759    7.8539815   3.          3.
 17.278759   17.278759    5.196152    5.196152    5.196152    5.196152
  5.196152    5.196152   10.97561     5.196152   10.97561     5.196152
  5.196152    5.196152    5.196152    5.196152   12.566371   12.566371
  1.0243902  12.566371    1.0243902  15.707963   15.707963   12.566371
  2.5         2.5        15.707963   15.707963   10.97561    10.97561
 10.97561    10.97561     0.70710677  0.70710677]
edge_dihedrals_np [ 7.8539819e-01  7.8539819e-01 -1.5707964e+00 -1.5707964e+00
  2.4492937e-16  1.5707964e+00  0.0000000e+00 -1.5707964e+00
 -1.5707964e+00  1.5707964e+00  0.0000000e+00  2.4492937e-16
  1.5707964e+00  1.5707964e+00 -1.5707964e+00 -1.5707964e+00
 -1.5707964e+00 -1.5707964e+00 -1.5707964e+00 -1.5707964e+00
  1.0471976e+00  1.5707964e+00  1.0471976e+00  1.5707964e+00
  1.5707964e+00  1.5707964e+00  1.5707964e+00  1.5707964e+00
 -1.5707964e+00 -1.5707964e+00  2.4492937e-16  1.5707964e+00
  0.0000000e+00 -1.5707964e+00 -1.5707964e+00  1.5707964e+00
  0.0000000e+00  2.4492937e-16  7.8539819e-01  7.8539819e-01
  1.0471976e+00  1.0471976e+00  1.0471976e+00  1.0471976e+00
  0.0000000e+00  0.0000000e+00]
edge_convexities_np [1 1 2 2 3 1 3 2 2 1 3 3 1 1 2 2 2 2 2 2 1 1 1 1 1 1 1 1 2 2 3 1 3 2 2 1 3
 3 1 1 1 1 1 1 3 3]
edge_type_descrip {1: 'Circle', 0: 'Line'}
[27]:
viewer.terminate()