
Search Results Visualization
Important
Purpose: This guide is for Developers and Engineers who run CAD similarity search with CADSearch and want to visualize the returned hits.
For dataset exploration workflows (querying file IDs and viewing pre-generated previews), start with Data Visualization Experience.
Overview
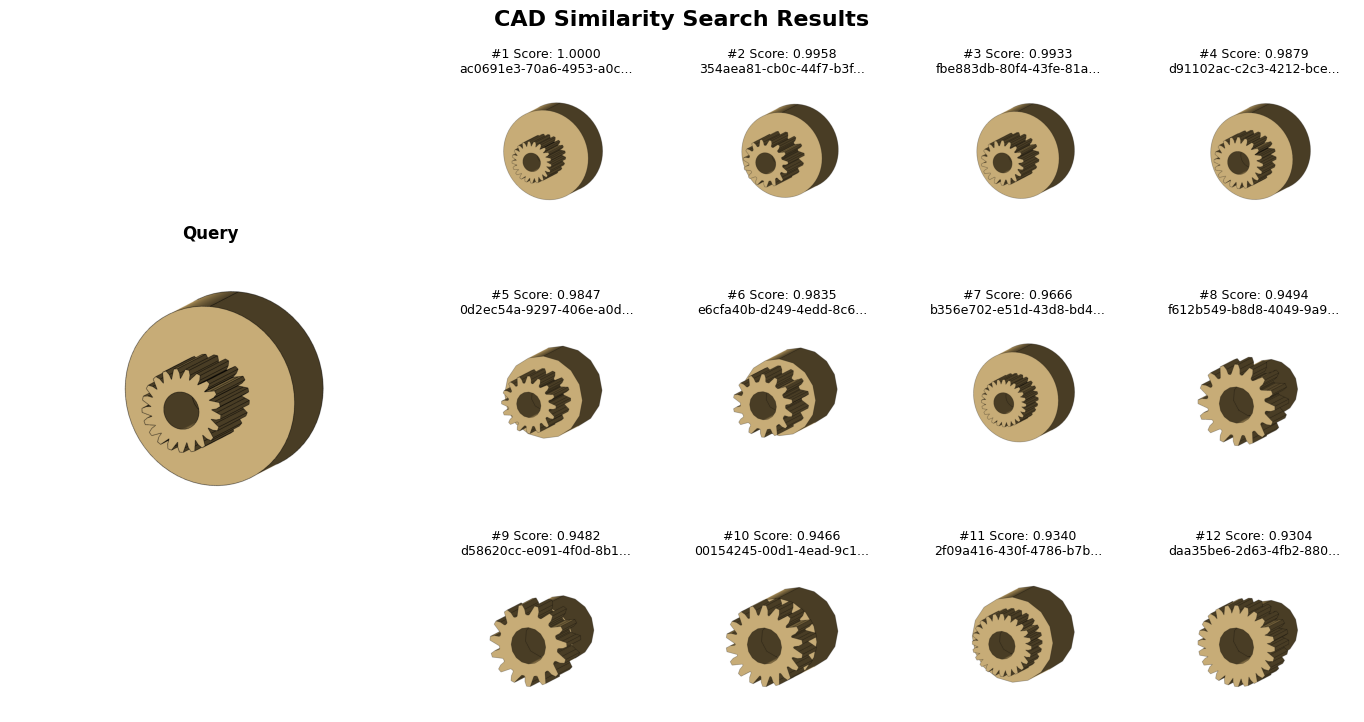
DatasetViewer can visualize similarity search results returned by CADSearch.
Instead of requiring pre-generated PNG previews, show_search_results() generates preview images on-the-fly from the CAD file paths stored in each search hit.
Optionally, you can pass a query CAD file path to display the query preview alongside the results.
Use this when you have:
A list of hits from
CADSearch.search_by_shape(...).CAD files accessible at the paths in each hit
Prerequisites
A working HOOPS AI installation and valid license
A list of search hits (objects with at least
.idand.score)The CAD files referenced by
hit.idmust be readable from the current machine
Important: show_search_results() treats hit.id as a CAD file path. This works directly when you indexed embeddings using file paths as IDs. If you indexed embeddings using non-path IDs (for example, integers or database keys), map each hit to its CAD file path before visualizing.
Quick Start
import hoops_ai
from hoops_ai.insights import DatasetViewer
from hoops_ai.ml import CADSearch

# 1) Set license (only needed once in your process)
hoops_ai.set_license("...")

# 2) Initialize viewer (empty for search results)
viewer = DatasetViewer(file_ids=[], png_paths=[], scs_paths=[])

# 3) Run a CAD similarity search (any approach that returns hits with .id/.score)
query_path = "query.step"

searcher = CADSearch(shape_model=embedder)
hits = searcher.search_by_shape(cad_path=query_path, top_k=10)

# 4) Visualize results
fig = viewer.show_search_results(hits, query_file=query_path)
See Embeddings & Similarity Search for end-to-end retrieval examples.
What show_search_results does
At a high level, show_search_results():
Reads the CAD file path from each hit (
hit.id)Generates PNG preview images into an output folder
Displays the results in a grid
Optionally adds labels (scores and/or filenames)
Optionally saves the figure to an image file
If query_file is provided, the query CAD file is loaded and displayed alongside the hit grid.
Common Patterns
Show the query part next to results
fig = viewer.show_search_results(hits, query_file=query_path)
Custom grid layout
fig = viewer.show_search_results(
    hits,
    k=16,           # Show top 16 results
    grid_cols=4,    # 4 columns (4x4 grid)
    title="Search Results for Gear Parts"
)
Scores only (hide filenames)
fig = viewer.show_search_results(
   hits,
   show_filenames=False,  # Hide filenames
   show_scores=True       # Show scores only
)
Limit and format a large result set
fig = viewer.show_search_results(
   hits,
   k=25,           # Show top 25
   grid_cols=5,    # 5x5 grid
   figsize=(20, 20)  # Larger figure
)
Save Results to File
fig = viewer.show_search_results(
   hits,
   save_path="results/search_output.png",
   output_dir="results/pngs"  # Where to save generated PNGs
)
Visualize multiple queries with organized output folders
When you run many searches, it is often helpful to keep each query’s generated previews in its own folder.
Here’s an example for how to organize generated PNGs by search query:
from pathlib import Path

viewer = DatasetViewer(file_ids=[], png_paths=[], scs_paths=[])

query_files = [
    "queries/part_a.step",
    "queries/part_b.step",
]

for query_file in query_files:
   hits = searcher.search_by_shape(query_file, top_k=10)
   output_dir = f"results/{Path(query_file).stem}"
   fig = viewer.show_search_results(hits, output_dir=output_dir)
Parameter Reference
Parameter |
Type |
Default |
Description |
|---|---|---|---|
|
list |
Required |
Search hits returned by CADSearch (each hit must expose |
|
str | Path |
None |
Optional CAD file path to render and display alongside the hit grid |
|
str | Path |
Auto |
Where generated PNG previews are written. If not provided, uses the viewer reference directory when available, otherwise |
|
int |
None |
Maximum number of hits to display (None = show all) |
|
int |
4 |
Number of columns in the results grid |
|
tuple |
Auto |
Matplotlib figure size |
|
bool |
True |
Show similarity scores in the per-item labels |
|
bool |
True |
Show filenames in the per-item labels |
|
str |
“CAD Similarity Search Results” |
Figure title |
|
tuple |
(200, 200, 200) |
RGB color for placeholder tiles when a preview cannot be generated |
|
str | Path |
None |
Save the figure to this file path |
|
bool |
True |
Use a white background when exporting PNG previews |
|
bool |
True |
Overwrite existing generated PNG previews in |
Comparison with other DatasetViewer methods
Method |
Input |
Use case |
|---|---|---|
File IDs |
Dataset exploration using pre-generated PNG previews |
|
Search hits |
Similarity search visualization with on-the-fly PNG generation |
|
File IDs |
Interactive 3D viewing of dataset items |
Tips and Best Practices
Minimal viewer initialization for search results
If you only need to visualize search hits (not explore a dataset by file IDs), an empty viewer is sufficient:
viewer = DatasetViewer(file_ids=[], png_paths=[], scs_paths=[])
Performance for large result sets
For displaying many results, generate PNGs beforehand:
# Generate all PNGs first
for hit in hits[:k]:
   model = loader.create_from_file(hit.id)
   tools.exportStreamCache(model, f"pngs/{hit.id}")

# Then visualize (will be faster)
fig = viewer.show_search_results(hits, output_dir="pngs")
Error Handling
The method handles failed CAD loads gracefully with placeholders:
# Will show gray placeholders for any files that fail to load
fig = viewer.show_search_results(
    hits,
    missing_color=(220, 220, 220)  # Light gray for failed loads
)
Troubleshooting
No search hits provided
If hits is empty, nothing can be visualized. Check that your search call returned results.
Note: when hits is empty, show_search_results(...) returns None.
if hits:
    fig = viewer.show_search_results(hits)
else:
    print("No search results to display")
Gray placeholders instead of images
If you get placeholder tiles (or previews fail to generate), enable logging to see the underlying load/export failures.
Placeholders typically indicate the CAD file could not be loaded or a PNG could not be generated.
Common causes:
The path stored in
hit.iddoes not exist on this machineThe CAD file format cannot be loaded
The file is corrupted
Solutions: Check logs for specific error messages:
import logging
logging.basicConfig(level=logging.INFO)
fig = viewer.show_search_results(hits)
Slow performance for many results
Solution: Limit results with k parameter:
# Only show top 10 even if you have 100 hits
fig = viewer.show_search_results(hits, k=10)
Resource cleanup
DatasetViewer initializes a process pool for parallel preview generation. When you are done with a viewer, call close() to release resources.
viewer = DatasetViewer(file_ids=[], png_paths=[], scs_paths=[])
viewer.show_search_results(hits)
viewer.close()
Or use a context manager:
with DatasetViewer(file_ids=[], png_paths=[], scs_paths=[]) as viewer:
    viewer.show_search_results(hits)
Migrating from legacy visualization helpers
If you previously had a notebook-only helper that took a list of hits and manually exported preview images, you can typically replace it with a single call to show_search_results().
# Old approach (Notebook Function)
def visualize_cad_hits(hits, loader, output_dir=None, cols=4, figsize_per_col=4):
   # ... implementation ...

fig = visualize_cad_hits(hits, loader, "out", cols=5, figsize_per_col=3)

# New approach (DatasetViewer Method)
viewer = DatasetViewer([], [], [])
fig = viewer.show_search_results(
   hits,
   output_dir="out",
   grid_cols=5
)
Benefits of the new approach:
✅ No need to pass loader separately (handled internally)
✅ Better error handling
✅ More customization options
✅ Consistent API with other DatasetViewer methods
✅ Automatic figure sizing