Technical Overview
HOOPS Visualize Desktop is a development platform that enables rapid development of high-performance, cross-platform engineering applications. Some of the key features include:
- High-performance, engineering-centric visualization which uses highly optimized OpenGL or DirectX drivers to take full advantage of available graphics hardware
- Thread-safe C++ and C# interfaces, which internally utilize multi-threading
- GUI-independent event handling to facilitate code portability across common GUI frameworks such as MFC, WPF, QT, and Cocoa
The cornerstone of HOOPS Visualize Desktop is the graphics kernel, a full-featured, engineering-focused scene-graph technology that we call Core Graphics. Core Graphics is integrated into a framework that provides many of the standard capabilities found in engineering applications. A number of these capabilities are encapsulated in the software components layer of HOOPS Visualize Desktop called Sprockets.
Sprockets hooks into the event loop of the application and provides many of the standard operators used in engineering software applications. The operators in Sprockets range from simple camera operators to advanced measurement and redline operators. The APIs to these operators are designed to give developers full flexibility to customize them to meet their needs.
The Sprockets layer also includes integrations of a variety of complementary components that are widely used within engineering software applications. Through these integrations, developers can easily load and interact with a wide variety of CAD data.
The HOOPS Exchange integration allows developers to easily import a wide variety of CAD formats.
Once the data is imported, developers can take advantage of high-level APIs to do common tasks like isolate/hide/show parts in an assembly and iterate through views in the model. Integrations with Autodesk’s RealDWG toolkit and Trimble’s SketchUp SDK are also provided.
The Sprockets layer also provides an integration of the Parasolid modelling kernel. This integration allows developers to quickly leverage the power of Parasolid in a working application.
Finally, HOOPS Visualize Desktop comes with a number of sample sandbox applications that demonstrate HOOPS Visualize Desktop working with the different GUI toolkits. Sandbox applications are provided for each of our supported GUI toolkit integrations and provide a good starting point for developing your application.
Architecture
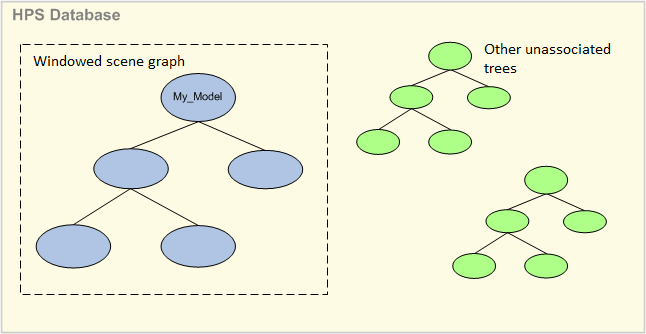
At its most fundamental, HOOPS Visualize Desktop is a graphics database which provides interfaces for creating, editing, manipulating, querying, and rendering the graphics information stored within. The graphics database is also referred to as a scene graph, which is a data structure consisting of nodes organized into a hierarchical tree. Developers may either build a custom scene graph to fit their specific needs, or operate on a scene graph that was automatically created using one of HOOPS Visualize Desktop’s file importers.
Segments
The nodes of a HOOPS Visualize Desktop scene graph are called segments. The HOOPS Visualize Desktop database stores graphical data in these segments. Think of a segment as a container for geometry and attributes that describe how the geometry is to be drawn. Segment-to-segment relationships are hierarchical and are described as “parent-child” pairings, or, as one segment “owning” its children. The mapping is one to many - one parent segment may have many child segments but every child segment has one unique parent segment.
Segments may be instanced several times and inserted into the tree in multiple places. This process is called inclusion, as in “one segment includes another”. Often, only the attribute set of a segment needs to be instanced and used by other segments; this process is called styling.
These segment to segment relationships result in a hierarchical tree structure, or more specifically, a directed acyclic graph. This structure enables attribute inheritance. Child segments have the same attribute values as their parent segment, unless they specifically have their own local settings for those attributes.
The HOOPS Visualize Desktop structure ensures optimal speed by partitioning the geometric data into objects with homogeneous attributes. This minimizes the need for the graphics hardware to change its display context during rendering and optimizes throughput.
The current support for geometric entities in HOOPS Visualize Desktop can be divided into groups as follows:
- 2D entities that can be used in 2D or 3D scenes - polylines, circles, ellipses, grids, text
- 3D polygonal entities - shells and meshes
- Higher-level primitives that are converted to triangles or lines for drawing - splines, NURBS, polycylinders
- Special case entities that serve a particular purpose other than simply defining geometry - lights, cut-planes, references.
Styles and Portfolios
In 3D visualization applications, information can be conveyed through how geometry is styled. For instance, you can apply a dashed pattern to a line to change the meaning of what that line represents. For example, depending on what type of texture you apply to a sphere, it can look like a soccer ball or basketball. HOOPS Visualize Desktop such a concept with styles, which are a collection of attributes that can be applied to a segment, and by extension, the geometry within. The following attributes can also have custom style definitions:
- Glyphs: a 2D symbol used in styling markers, vertices, lines, and edge styles
- Image: a two dimensional array of pixels used as source for textures
- Texture: a description of how image source(s) will be applied to a given surface
- Line and edge style: a description of how a line is rendered using glyphs, arrow and caps
- Material palette: a list of colors and or images that can be referenced by index number. This can be used to apply textures to shells.
- Shader: a set of GPU instructions for altering the appearance of a pixel at render time.
The definitions described above exist within an structure called a portfolio, which is a library of resources that you can use to style the scene. You can create any number of portfolios with your own definitions as well as import definitions from existing portfolios. When you want to apply any of the definitions in a portfolio to geometry in your segment tree, you simply assign the portfolio to the segment which contains that geometry.
Conditional styling is also supported, which allows the scene graph to be automatically changed at draw time based on user-defined conditions.
Geometry Types
Shells
3D applications typically represent 3D objects with an “indexed face set” or “polygon-point mesh”. In HOOPS Visualize Desktop, such primitives are called ‘shells’. A shell defines the boundary surface of an object in 3D using a set of planar polygons. Polygons can be multi-sided and can include holes. A shell is defined as an array of vertices (3D points) and an array of indices into the vertex array that define each polygonal face.
HOOPS Visualize Desktop supports a wide range of advanced functionality relating to shells, including the ability to select, highlight, and modify individual sub-entities (faces, edges, and vertices). Attributes such as normals, colors, and texture coordinates can also be set at the sub-entity level to enable a variety of complex shading and display.
Lines and Text
Other common HOOPS Visualize Desktop primitives are lines and text, which are fully 3D transformable. HOOPS Visualize Desktop supports a wide number of pre-defined line styles, end caps, glyphs, as well interfaces for controlling line thickness, multi-lines, disjoint, and infinite lines. Application developers can define their own custom line and glyph styles.
Substantial effort has been made to support fast, high-quality text display within HOOPS Visualize Desktop, and to match this display in hardcopy drivers. Some of the key features in the text pipeline are:
- Pre-defined stroke fonts
- Support for system, TrueType, OpenType, Type1 and user-defined fonts
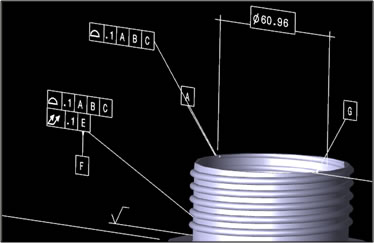
- A Tech Soft 3D font is provided for PMI/GD&T display
- Full internationalization support including Unicode/MBCS and UTF-8, UTF-16, and UTF-32 encoding.
- Functions to convert text to geometry, multiline support, text justification and layout options, automatically switch fonts at different screen sizes to enhance readability
- Ability to set different attributes per character in a text string
- Text greeking to improve performance by limiting drawing of text when they are small on-screen
Display Drivers
One of the key features of HOOPS Visualize Desktop is its ability to provide a device-independent description of 2D and 3D scenes, and render them with consistent results across all supported devices and platforms. The code responsible for interpreting the HOOPS Visualize Desktop database and translating it to a particular device is called a driver. HOOPS Visualize Desktop drivers provide support for display, raster-image, PDF, and hardcopy.
Many HOOPS Visualize Desktop applications are primarily concerned with screen-based interaction. The supported display drivers are OpenGL and DirectX. A full software pipeline is also provided for use in situations where hardware acceleration is not available or is problematic.
Print and Plot Support
Hardware-based rendering APIs such as OpenGL and DirectX do not offer support for printing and plotting. While it is possible to capture the image that has been drawn and use it for printing, this technique is likely to be slow, is prone to using excessive memory, and in many circumstances will have unacceptable quality since the output device’s native drawing algorithms are not used.
HOOPS Visualize Desktop hardcopy drivers, which include Adobe PDF, Postscript, and Microsoft Windows GDI, are optimized for each device in order to make use of the native primitives provided by that output API. Support for hybrid vector/raster hardcopy generation is provided. Additionally, rasterized parts of the scene such as shaded or textured objects are accurately rendered using the device’s raster interface, while vector parts of the scene such as lines, edges, and text are drawn using the device’s native vector interface. Vector primitives are drawn using hidden-line removal, allowing them to be interleaved with the 3D rasterized objects, rather than just being drawn on top. In summary, HOOPS Visualize Desktop provides efficient, high-quality hardcopy regardless of the scene contents or hardcopy interface.
The DPI resolution of the rasterized geometry can be controlled by the developer, allowing them to determine the trade off between accuracy, speed, and memory usage during hardcopy generation.
Scene-Graph and Drivers Flexibility
The HOOPS Visualize Desktop scene graph and driver system has been built from the ground up to provide a high degree of flexibility for application developers. For example:
- HOOPS Visualize Desktop can run multiple different drivers simultaneously. Each driver may be associated with an on-screen (OpenGL, Direct3D) or off-screen (print, plot, image export) context.
- Any segment in the scene graph can be exported without exporting the entire scene graph.
- Data can be loaded from disk into any segment of the scene graph without altering other sections of the scene graph
- Multiple windows or views of the same part of the scene graph can be visualized simultaneously in an attribute-independent way
- Multiple windows or views of different parts of the scene graph can be visualized simultaneously
Selection and Highlighting
The HOOPS Visualize Desktop libraries provide multiple operations for selection and several advanced highlighting techniques. Control over what is targeted for selection is configurable:
Segments in the scene graph can be marked as available for selection The selection level can be specified - entity, geometry, segment, or segment tree. Selection of individual vertices, edges and faces can be configured The number of selected items to search for is configurable The selection proximity can be used to select the nearest item on screen within a screen-based tolerance Selections can be made of all items inside and outside a drag box, inside arbitrary screen regions defined by polylines or polygons, by a volume of 3D space, and by an arbitrary triangle mesh in 3D for clash/collision detection.
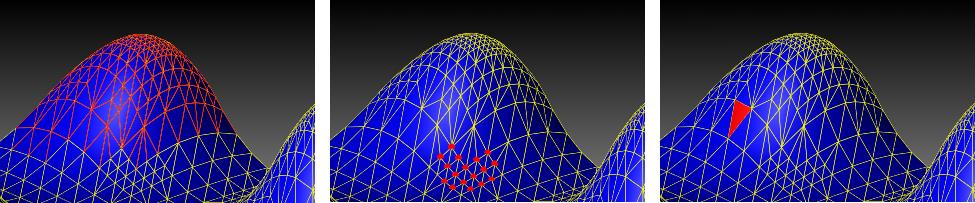
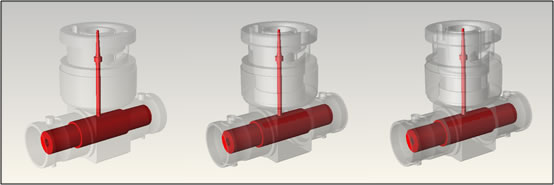
Edge selection (left), vertex selection (center), and face selection (right)
HOOPS Visualize Desktop provides a number of highlighting modes:
- Standard override - change the color of the segment and optionally use an attribute lock to force the child segments to also change color
- Overlay - usage of overlay techniques to quickly redraw the highlighted objects either on top of the current view, or depth sorted
Transparency
Fast, accurate multi-layer transparency has historically been a challenge in 3D graphics, because ensuring correct blending of overlapping transparency geometry typically has required drawing the scene in a back-to-front order. As model size increases, this can severely impact performance.
HOOPS Visualize Desktop offers a number of transparency algorithms offering both high quality and high performance:
- Screen-door: this provides very fast drawing by substituting true transparency blending with a screen-door effect where only a fraction of pixels in a transparent object are drawn, allowing objects behind to show through. No sorting is performed. This can be an effective technique when navigating around a model
- Painters algorithm: A sort-based method that gives a completely accurate rendering of scenes at the expense of performance, useful for high-quality printing and plotting
- Z-sort: sorts either all the triangles in the scene based on the triangle’s center (“nice”) or all the objects in the scene (“fast”). The former gives high quality results for small scenes, the latter is useful for fast inverse-transparency highlighting in large scenes.
- Depth peeling: this utilizes order-independent techniques and is the algorithm of choice for use with modern graphics cards. Performance varies with screen resolution and the number of layers of transparency chosen to be drawn, rather than with model size. The implementation is optimized to minimize the amount of redrawing and take advantage of extended hardware capabilities
Bounded Section Planes
While OpenGL and DirectX provide support for cutting planes, HOOPS Visualize Desktop extends that support with software calculations of the ‘capping edges’ and ‘capping faces’. These are also referred to as bounded sectioning-planes.
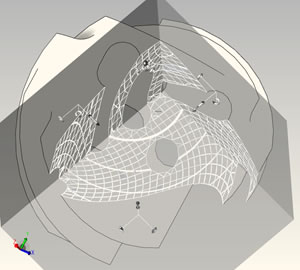
Three sided bounded sections through a mechanical model (left) and a tetrahedral mesh (right)
HOOPS Visualize Desktop support includes:
- Local visibility settings for cut planes so that parts of the scene graph can be left unaffected by the cut-plane
- Calculation of polyline cut boundaries and end-cap geometry.
- Cutting sections that allow two and three-sided bounding sections through models to show ¾ and other complex section views
- Bounded slices through the scene
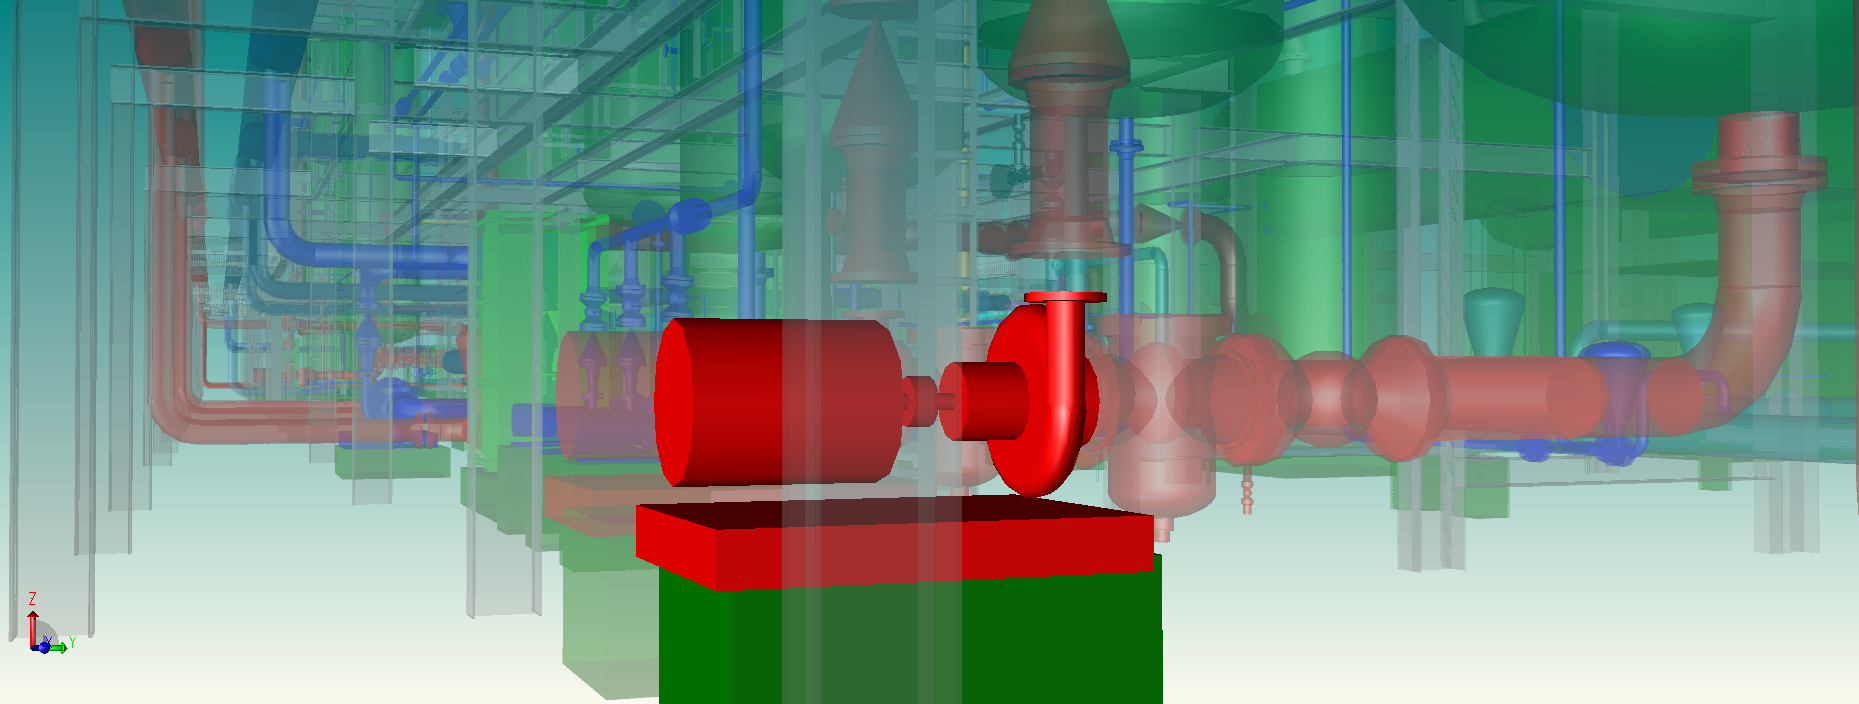
A bounded three-sided section through a large plant dataset showing internal pipes
Overlays and 3D-Spriting
Overlay support involves drawing entities on the screen without redrawing the rest of the scene. Examples include a rubber-band box for selection or to specify a zoom area, or dragging a piece of geometry through the scene.
In addition to normal overlay, HOOPS Visualize Desktop has an advanced overlay mode which utilizes a 3D-spriting technique. When specified with the normal overlay attribute, geometry is drawn on top of the scene and no depth-test occurs. With 3D-spriting, the object is drawn in full 3D with a correct depth test. 3D-spriting is a valuable optimization in large scenes, which allows objects to be correctly highlighted, moved and redrawn without the need to redraw the entire scene.
Polygonal Clip Regions
It is very common for users of HOOPS Visualize Desktop-based applications to work in 3D. However, in many cases the final product is a 2D report or a set of 2D drawings. HOOPS Visualize Desktop provides a range of capabilities to help automatically generate 2D drawings from 3D models. These include configurable hidden line, section boundary and end-cap generation and polygonal clip regions.
A polygonal clip region is defined by an arbitrarily-shaped convex polygon - for example, a circle. When inserted in the HOOPS scene graph all geometry below that segment is clipped so that only the portions within the polygonal region are drawn. This capability is extremely useful for adding detail sections to a drawing.
Point Clouds
As laser scanning becomes more prevalent across a range of industries, large point-based datasets are becoming mainstream. HOOPS Visualize Desktop provides a range of interactive navigation and analysis tools specifically aimed at working with point clouds and laser scan data.
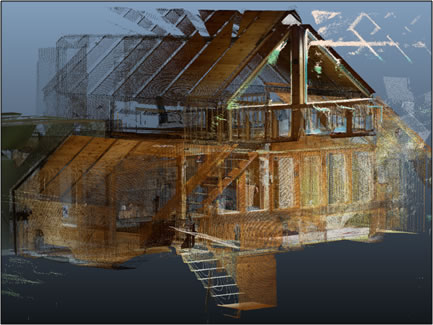
A laser scan of a log cabin seen from the outside.
In HOOPS Visualize Desktop , point clouds are represented using the shell primitive with a null face list array. The vertex marker primitive offers hardware-accelerated, shader-based “splat-rendering” where each point is drawn as a disc or a square. By increasing the on-screen size of each point, surfaces become opaque even in areas with relatively low point density. This has the substantial advantage that useful visualization can be achieved with a smaller number of points.
Point clouds usually do not include color data and, as a result, it’s often difficult to pick out features in the point cloud model. HOOPS Visualize Desktop provides an eye-dome shader which specifically addresses this problem. It gives the effect of providing depth to a point cloud, greatly improving the viewing experience. See the images below for an example:
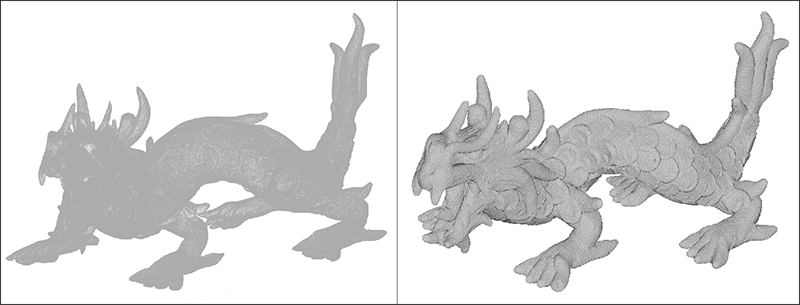
An unmodified point cloud (left) and the same point cloud with the eye dome lighting effect applied (right)
The “vertex decimation” rendering option provides a dynamic level-of-detail capability so that only a percentage of vertex markers in each point cloud are drawn per frame. This technique works particularly well with randomized point clouds and constant frame rate algorithms.
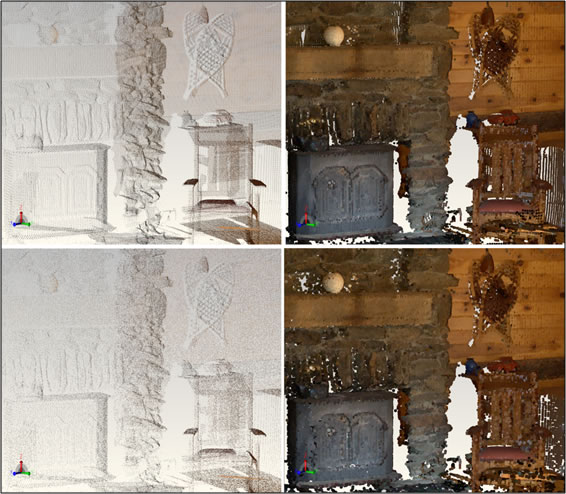
A laser scan of the interior of a log cabin. Full resolution (top left), full resolution with splat rendering (top right), 50% dynamic LOD (bottom left), 50% dynamic LOD with splats (bottom right)
As well as fast display of large point clouds, HOOPS Visualize Desktop offers a variety of measurement utilities, including nearest-distance calculations between individual points as well as points and CAD geometry. Multi-threaded routines are available to compare an entire point cloud with the triangle-based data, shading each point appropriately relative to a table of tolerance distances. These capabilities can be used to rapidly calculate collisions between geometry and laser-scan data, for example, when designing new pipe layouts in a scan of an existing process plant.
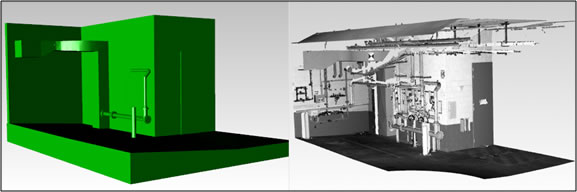
Original CAD geometry (left) and laser scan point cloud (right)
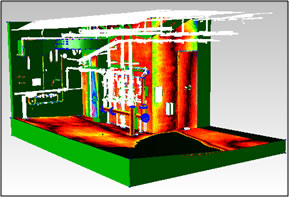
Combined distance tolerance comparison display
Performance
Retained Mode Benefits
Graphics systems that render primitives immediately, without storing them in a display list, are called immediate-mode systems. Systems that store graphics information in data structures specifically designed for the display of graphics are called retained mode graphics libraries. HOOPS Visualize Desktop retains graphics primitives in system memory, which provides various performance benefits.
- Selective Traversal - Because HOOPS Visualize Desktop keeps track of portions of the display that are not changing between updates, unnecessary redraws are eliminated.
- Incremental Updates - HOOPS Visualize Desktop includes update logic that allows geometry to be incrementally added to a scene without a full redraw.
- View-dependent drawing and culling - Because HOOPS Visualize Desktop retains a copy of all the primitives, it can perform faster modification and traversal of the graphics information as well as optimizations to make rendering the scene faster. For example, the graphics system can calculate bounding volumes that store the location and a rough measure of the extent of a set of primitives. During rendering, many primitives may not be visible on the screen. Bounding volumes allow the system to quickly determine whether a group of primitives is on-screen, or fall below a user-specified size limit, so that only those graphics primitives that are actually visible or are visually important are redrawn.
- Selection - An important function of a graphics system is performing selections. Without a copy of the primitives, the only way for the graphics system to perform a selection is to have the application resend and ‘hit test’ all the primitives. Retention of the primitives allows the graphics system to perform selection much faster.
Optimized Draw Pipeline
The graphics pipeline within HOOPS Visualize Desktop has been highly optimized to remove bottlenecks. Whenever possible, array-based data structures are used in preference to pointers to improve cache coherence. A dedicated, multi-threaded memory manager is used to deliver fast memory allocations and memory is automatically cleaned during idle time. Shaders are used heavily to work around performance bottlenecks.
HOOPS Visualize Desktop automatically creates and manages vertex buffers on the graphics card, mirroring the geometry data on the CPU. HOOPS Visualize Desktop works to ensure graphics card memory is not exhausted, which would otherwise cause the graphics driver to page main memory resulting in a catastrophic slowdown.
Scene Optimization
Context switching can significantly affect graphics throughput. Additionally, as scene size increases in terms of the amount and size of geometric entities, the chance that a particular graphics card will be powerful enough to interactively draw all the data decreases. A conceptually simple workaround to this situation is to not attempt to draw all the data, but rather draw the data that is most relevant.
This approach is commonly called culling. There are a variety of culling techniques supported by HOOPS Visualize Desktop, including backplane, view frustum and extent culling. Effective scene organization can lead to more effective culling as well as reducing context switching on the graphics card.
HOOPS Visualize Desktop also provides an attribute called static model which triggers an automatic optimization of the scene graph, without modifying the original structure that was created by the application. HOOPS Visualize Desktop creates an optimized ‘shadow’ internal tree and maintains a mapping with the original tree. Because geometry is not duplicated, only referenced, there is a minimal memory impact when using the static model.
Fixed Framerate
Reorganizing the scene and data on the graphics card can deliver significant performance improvements. However it may still be desirable to ensure that the system always delivers a specific frame rate.
HOOPS Visualize Desktop provides an interface to specify a framerate, and will draw the scene in a priority order depending on the current camera parameters. The priority of an object is determined by its screen size and its proximity to the viewer. Fixed framerate mode is useful when you want to ensure large models are still drawn at an interactive speed. For example, when the user is rotating an object, he usually does not care to see every detail and would rather the rotation be performed quickly. When using fixed-frame rate mode, HOOPS Visualize Desktop monitors the time that has been taken to draw the frame. When the time limit is exhausted, HOOPS Visualize Desktop interrupts the rendering process and starts the next frame. When navigation pauses or stops, HOOPS Visualize Desktop draws the rest of scene from the point at which the last render stopped.
The fixed framerate algorithm guarantees smooth navigation, and because the decision making is primarily CPU-based, it scales well from low-end to high-end graphics hardware.
Visual Quality
While the HOOPS Visualize Desktop toolkit is primarily focused on delivering high levels of performance and interactivity, visual quality is also important. This section briefly details some of the key features HOOPS Visualize Desktop offers in this area.
Advanced Shader Pipeline
HOOPS Visualize Desktop has a fully-developed shader pipeline for DirectX and OpenGL which offers the following advantages:
- Various techniques can be provided and performance can be improved by using shaders. Possibilities include fast hidden line rendering, silhouette edges, wide lines, fast and accurate multi-layer transparency, advanced shadowing techniques, and more.
- Where possible, there is substantial code sharing between the DirectX and OpenGL drivers. This improves stability and accuracy across graphics cards that implement shaders as the same HOOPS code is executed on all these cards.
- The amount of card-driver dependent code in use is reduced.
- Performance drops on these graphics cards are reduced as more functionality is now executed in shaders provided by HOOPS Visualize Desktop.
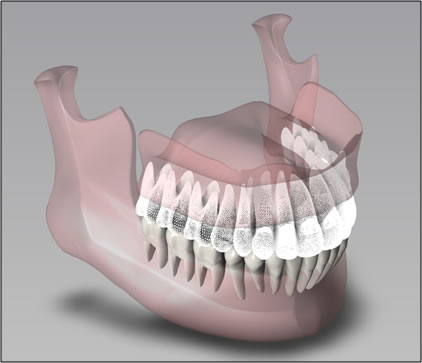
Jaw model with multi-layer transparency and ambient occlusion
Shading Models
HOOPS Visualize Desktop supports the standard Gouraud and Phong shading models.
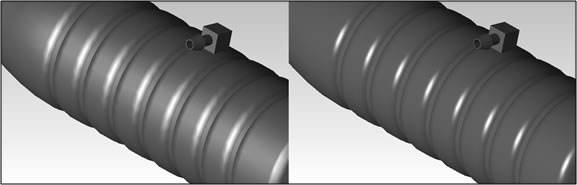
|HPSNOW| Gouraud shading (left) and Phong shading (right)
Physically-based Rendering
HOOPS Visualize Desktop now supports Physically Based Rendering for more realistic rendering.
Material properties can be set via the API or by loading GLTF models through the Exchange Sprocket.
Color Interpolation
A broad range of applications require a visual representation of values that have been obtained through extra calculations or external measurements. For example, finite element and computational fluid dynamics, or oil reservoir and mine engineering both benefit from such visual data. Examples range from the stress on the undercarriage of a plane during landing through estimates of mineral amounts from geological models.
Color interpolation involves setting a color representing the external value on each vertex of each face. Colors are then interpolated across the face to give an approximate representation of how the values change across each face, and hence across the entire model. HOOPS Visualize Desktop also offers color index interpolation which uses textures and texture maps to accurately display the changes between colors in a specified color map.
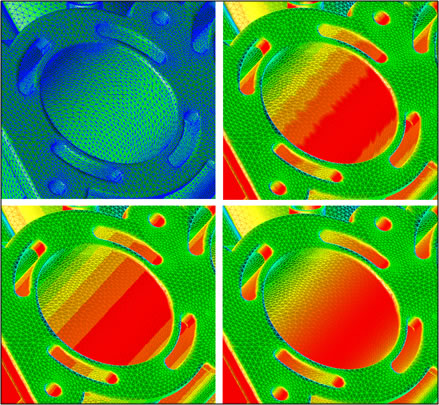
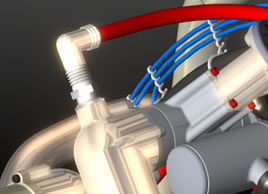
Section of an engine block showing mesh edges (top left), color interpolation (top right), color index interpolation (bottom left) and blended index interpolation (bottom right)
Isolines and Contour Lines
Consider that each vertex in polygon mesh (shell) represents a real-world value. It is therefore possible to calculate lines that lie on the surface of the mesh of constant value. These are called isolines, or contour lines, and HOOPS Visualize Desktop provides a variety of functions to calculate and display them.
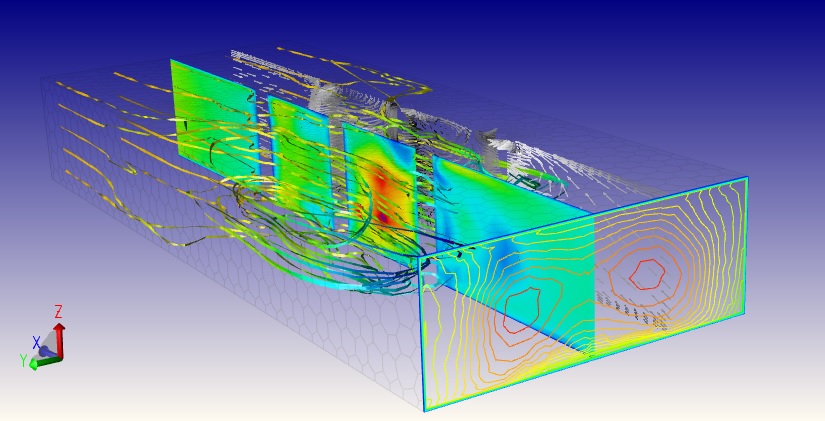
Isolines calculated as part of an airflow simulation. Also depicts color-interpolated ‘ribbon’ paths
Textures
One of the most commonly used methods to enhance realism is to map a 2D image (bitmap) onto surfaces in the 2D or 3D scene.
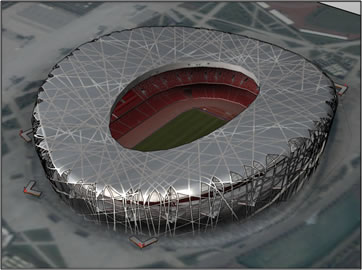
A stadium model enhanced using texture mapping
HOOPS Visualize Desktop has extensive support for textures and texture mapping including:
- using images for the window background
- applying textures as decals (applying text and logos to surfaces)
- applying multiple textures to different faces in a shell
- environment mapping and zebra striping to visualize surface continuity
- support for grayscale and compressed images which can in turn be used to reduce texture size. (Supported formats include JPEG, TARGA, DXT1, DXT3 and DXT5.)
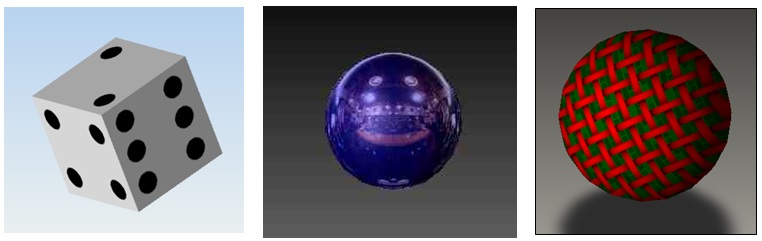
Different textures on faces in a shell (left), environment mapping middle, overlapping textures (right)
Zebra-striped shading to analyze surface curvature
Shaders
The following advanced functions are implemented using HOOPS Visualize Desktop’s support for GPU shaders.
Bump maps
Bump mapping is a technique used to convey surface texture and roughness. A specific lighting calculation is carried out for each pixel based on a bump map that describes the height of the surface at each point.
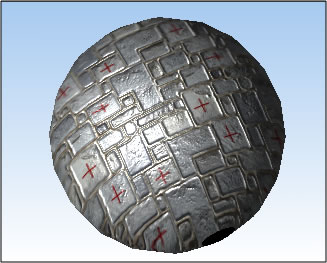
A stone wall texture with a bump applied.
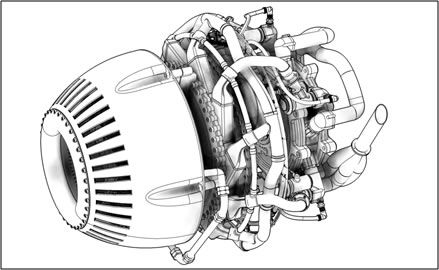
Fast silhouette edges
HOOPS Visualize Desktop provides control over whether interior and exterior (perimeter) silhouette edges are drawn. Using the standard fixed function pipeline there is always the possibility that the face display will interfere with the interior edge display causing stitching artifacts.
Fast silhouette edges are a shader-based technique based on examining differences in values in the z-buffer, rather than inferring the edges from the topological definition. As the name suggested, this technique offers dramatically better performance.
A “heavy exterior” sub-option can be enabled to draw the external edges more thickly. Combined with Gooch shading this gives a technical drawing appearance.
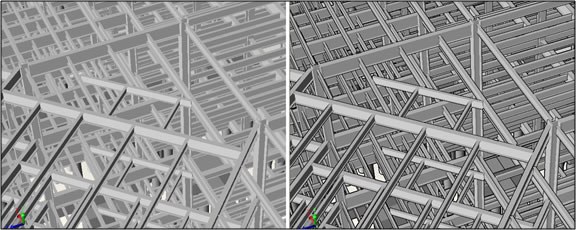
A structural steel model with normal lighting (left) and enhanced silhouette edges (right)
Real-time Shadows
Traditionally, accurate shadow calculations have been very computationally expensive and largely the preserve of ray-tracing systems, where much of the expense of calculating the shadows has already been performed as part of the ray-trace.
HOOPS Visualize Desktop provides GPU-based shadow mapping which uses a two-pass rendering technique to simulate accurate shadows in real-time based on the z-buffer and textures. Advanced options include automatically regenerating the shadow map resolution as the camera zooms in and out, and adding a jitter effect to blur the hard edges of the shadows.

A structural steel model with normal lighting (left) and enhanced silhouette edges (right)
Ambient Occlusion
Ambient occlusion is a technique that uses global lighting calculations to identify occluded areas and reduce the ambient light in these areas. It gives a soft shadowing effect to the model and enhances contrast to accentuate the model.
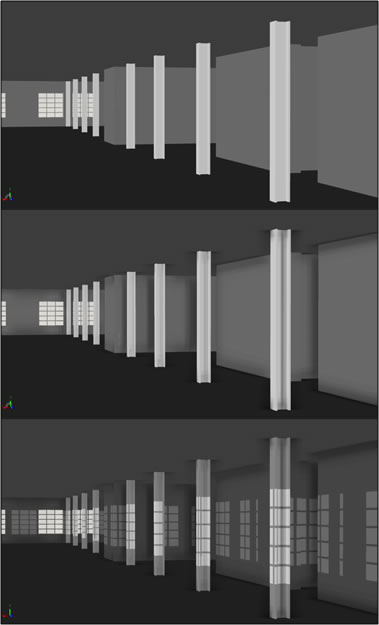
An architectural interior with flat lighting (top), ambient occlusion (middle) and real-time shadows (bottom)
Ambient occlusion is also very effective when used together with fake hidden line:
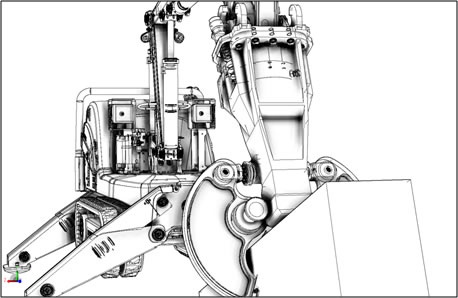
A mechanical model rendered with fake hidden line and ambient occlusion.
Bloom
Bloom provides a type of HDR effect, and enhances specular highlights. It is particularly effective when used in conjunction with environment mapping to represent reflective surfaces.
Reflection Planes
Reflection planes mirror the scene and give a perceived mirror quality to the boundary between the reflection and the scene. This can be particularly effective for the display of mechanical designs. HOOPS Visualize Desktop provides a number of options including blurring, transparency and distance attenuation.