Scalar Results
Scalar results are single data values given per node, per element, per element node, or per element surface. Examples of scalar results are temperature, components of stress and strain etc.
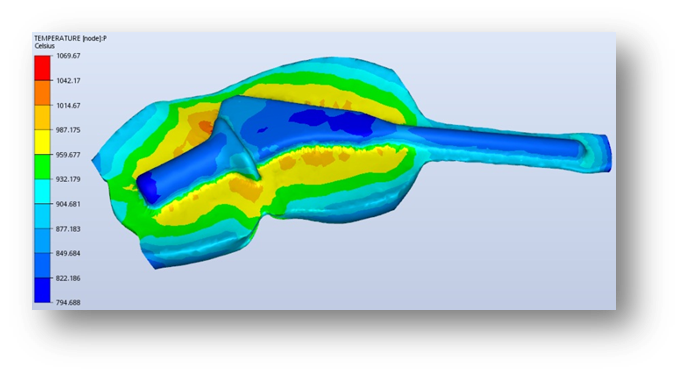
Fringes is a popular scalar technique that maps scalar data to models using the shading facilities of HOOPS Envision for Desktop. For the fringes representation, each legend color level applies to a scalar value interval. Fringes are well suited techniques for visualizing the distribution of scalar data on planes or surfaces. In themselves, fringes only allow the user to see results on the outer surface of 3D volumes. To visualize data distribution inside a volumetric grid, cutting planes, isosurfaces and isovolumes are effective techniques.


Which scalars results to show as fringes are set up in the model specification. Scalars can also be shown as contour
lines. See ModelSpec for further descriptions. In addition, a scalar result can
also be used to define a isosurface/isovolume, or be mapped on an isosurface, an isovolume or a cutting plane.
The scalar result has various settings (ScalarSettings that can be configured to make
a better visual appearance of your result data, for instance specifying a legend scheme, legend range or filtering.
Each scalar result has its own settings. Get scalar settings for a specific scalar result by calling
UnstructGridModel::scalarSettings() with the requested id.
Range
The range specifies the minimum and maximum value for the color scheme to fill.
Set a custom range with setRange(double min, double max) and get the
current range using rangeMinimum() and
rangeMaximum(). To set the color scheme to automatically span a range of
scalar values, select a mode using setAutoRangeMode().
Color Mapping and Scheme
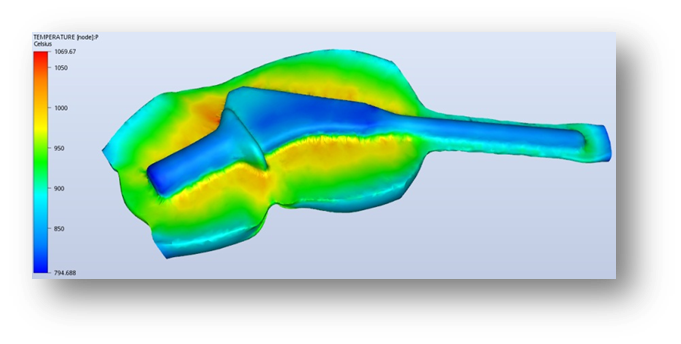
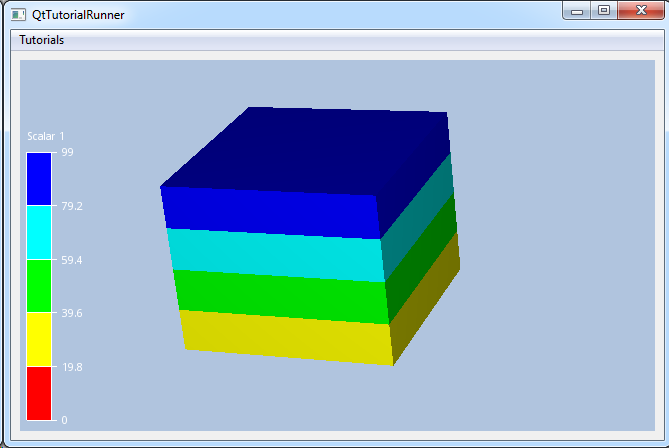
The color mapping can be either filled contours with uniform level size, custom level size, or continuous.
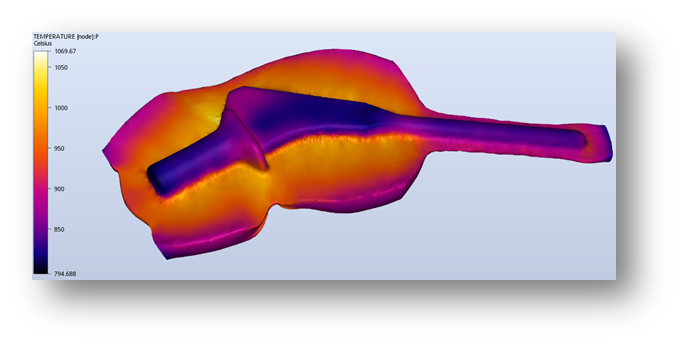
There are several predefined color schemes to choose from, or you can specify your own custom scheme.
The ColorMapper object can be accessed through colorMapper().
See ColorMapper for further description on setting color mapping and scheme.
Legend
The color legend provides an overlay item in the view that shows the current results’
legend colors, range and filtering. Legend visibility is toggled with
setLegendVisibilityMode()
The legend width, colors, line widths, tick marks and text can be customized.
Filtering
Elements can be filtered based on scalar values and a filtering minimum and maximum. Elements with scalar
values outside the specified range, will be set invisible.
Set the filtering visible range using
setFringesElementFilteringVisibleRange().
And also choose to filter undefined values using
setFilterUndefinedElements().
ScalarSettings are available from
UnstructGridModel.
Tutorial
 |
UnstructGrid: Set Scalar Settings on a Loaded Model Shows how to change scalar settings for visualized result. |

