cee::plt::OverlayPlot
-
class
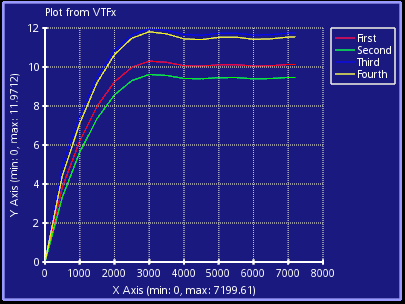
OverlayPlot: public OverlayItem Overlay item with basic 2D plotting.
A view overlay item capable of showing a 2D plot (with optional border and background). The overlay plot can have any number of curves and offers a curve legend and a marker line. Various settings such as range, titles and colors(text, curve, lines, background, …) can be set.
See the topic 2D Plotting
An overlay plot contains one or more curves where each curve is a series of x- and y-values. These values can be saved and read from the VTFx model file. Plot settings, such as which curves are used in which plots, colors, titles and other, are saved as properties. (See PropertyApplierPlot2d and PropertyBuilderPlot2d).
The overlay item can be added to a view using the View::overlay() and Overlay::addItem(). The view manages the layout of the overlay items, so only a desired size can be given in this class. The position is specified when the overlay item is added to the view.
An overlay item can be shown in multiple views at the same time.
The demo apps found in the HOOPS Envision distribution offers example code for import, export and usage of plot data and overlay plots.
See also
cee::vis::OverlayItem and cee::vis::Overlay, and cee::vis::View
Public Types
Public Functions
-
bool
drawBackground() const Returns true if plot background is drawn.
-
void
setDrawBackground(bool drawBackground) Specifies if the border should be drawn or not.
-
float
backgroundOpacity() const Returns the opacity of the background.
1.0 = opaque, 0.0 = fully transparent
-
void
setBackgroundOpacity(float opacity) Sets the opacity (transparency) of the background of the overlay plot.
1.0 = opaque, 0.0 = fully transparent
-
float
borderWidth() const Returns the width of the border around the overlay plot in pixels.
-
void
setBorderWidth(float width) Sets the width in pixels of the border around the overlay plot.
-
bool
drawBorder() const Returns true if the border is drawn.
-
void
setDrawBorder(bool drawBorder) Specifies if the border should be drawn or not.
-
const AxisSettings &
axisSettings() const Returns the axis settings for this plot.
-
AxisSettings &
axisSettings() Returns the axis settings for this plot.
-
const MarkerLine &
markerLine() const Returns the marker line for this plot.
-
MarkerLine &
markerLine() Returns the marker line for this plot.
-
bool
drawCurveLegend() const Returns true if the curve legend is drawn.
-
void
setDrawCurveLegend(bool drawCurveLegend) Specifies if the curve legend is drawn or not.
-
LegendPosition
curveLegendPosition() const Returns the curve legend position.
-
void
setCurveLegendPosition(LegendPosition position) Sets the curve legend position.
-
size_t
curveCount() const Returns the number of curves in this plot.
-
Curve *
addCurve(const Str &curveName, const std::vector<double> &xValues, const std::vector<double> &yValues) Adds a curve to the plot specifying a name and an x- and y-value array.
-
void
removeAllCurves() Removes all curves from the plot.
-
void
removeCurve(size_t curveIndex) Removes the curve at the specified index from the plot.
-
double
xValuesMinimum() const Returns the minimum x value of all curves in the plot.
-
double
xValuesMaximum() const Returns the maximum x value of all curves in the plot.
-
double
yValuesMinimum() const Returns the minimum y value of all curves in the plot.
-
double
yValuesMaximum() const Returns the maximum y value of all curves in the plot.
-
bool