2D plotting
The 2D plotting component offers basic 2D plot visualization directly into the View.
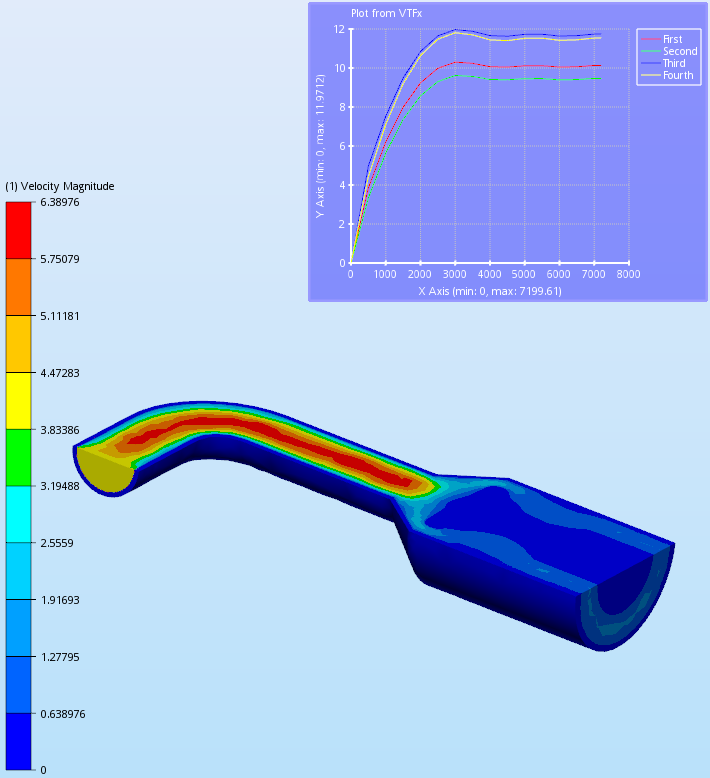
Plot data, along with plot properties, can be imported and exported to the VTFx file format.
Overlay item
The main class, OverlayPlot, is an overlay item that can be added to the view. An OverlayPlot contains
any number of curves where each curve contains a series of x- and y-value pairs. Each
curve also has a title and a color. The overlay plot offers a marker line and a curve legend.
Various settings such as range, titles and colors(text, curve, lines, background, …) can
be set.
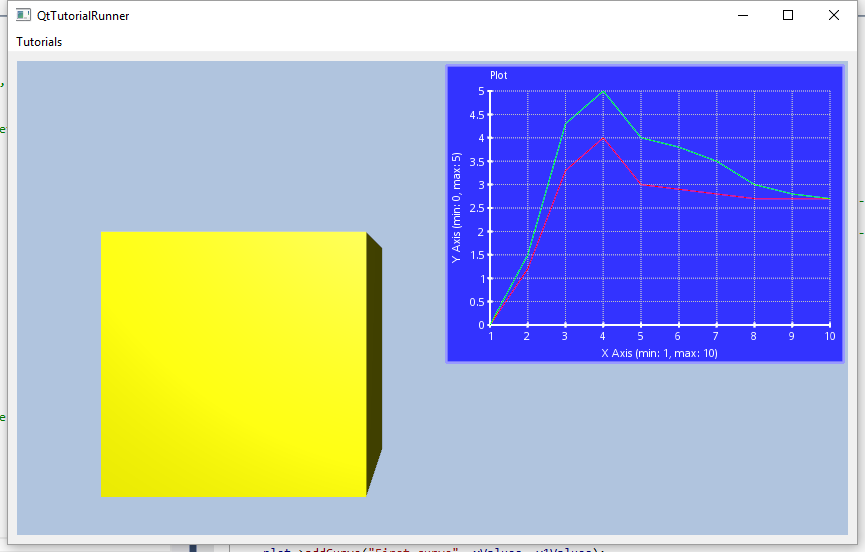
Create a simple plot:
cee::PtrRef<cee::vis::Font> normalFont = cee::vis::Font::createNormalFont();
cee::plt::OverlayPlot* plot = new cee::plt::OverlayPlot(normalFont.get());
plot->setSize(400, 300);
plot->setTitle("Plot from VTFx");

std::vector<double> xValues = ...;
std::vector<double> yValues = ...;

plot->addCurve("My curve", xValues, yValues);

view->overlay().addItem(plot, cee::vis::OverlayItem::TOP_RIGHT, cee::vis::OverlayItem::HORIZONTAL);
Import
The plot data can be stored within the VTFx file. To access plot data, use the DataSourceVTFx.
The VTFx data source can contain several plot data objects. Each plot data consists of multiple plot data variable objects, typically two; one variable for the x-values and one variable for the y-values.
The VTFx model file can contain properties describing one or more overlay plot. These properties contain settings such as size, colors and titles in addition to specifying which of the plot data variables that are used as curves in each plot.
Just a few lines of code will enable you to import the overlay plots based on plot properties found in the VTFx file:
cee::ug::PropertyApplierPlot2d propPlotApplier(propertyCollection.get(), source);
for (size_t i = 0; i < propPlotApplier.plotCount(); i++)
{
    cee::PtrRef<cee::plt::OverlayPlot> plot = propPlotApplier.createOverlayPlot(i, cee::vis::Font::createNormalFont().get());
    gcView->overlay().addItem(plot.get(), cee::vis::OverlayItem::TOP_RIGHT, cee::vis::OverlayItem::HORIZONTAL);
}
You can also get plot data manually from a DataSourceVTFx:
cee::ug::DataSourceVTFx* source = static_cast<cee::ug::DataSourceVTFx*>(m_unstructModel->dataSource());
for (size_t i = 0; i < source->plotDataCount(); i++)
{
    std::vector<double> xValues = source->plotDataVariableValues(i, 0);
    std::vector<double> yValues = source->plotDataVariableValues(i, 1);

    plot->addCurve("Curve", xValues, yValues);
}
Export
To export plot data, use the ExportVTFx. Each plot data contains a name, an array of
plot variable names and the same number of plot variable value arrays. Add one or more plot data using
addPlotData().
Save plot data to file (without properties):
cee::exp::ExportVTFx exporter(cee::exp::ExportVTFx::FULL_DATA_MODEL, m_unstructModel.get());
std::vector<cee::Str> variableNames;
std::vector<std::vector<double> > variableData;

variableNames.push_back("X Values");
variableNames.push_back("Y Values");

std::vector<double> xValues = ...;
std::vector<double> yValues = ...;
variableData.push_back(xValues);
variableData.push_back(yValues);

exporter.addPlotData("Curve", variableNames, variableData);
exporter.saveCase(fileName);
Save plot AND properties to file (exporting all visible plots data and settings):
cee::exp::ExportVTFx exporter(cee::exp::ExportVTFx::FULL_DATA_MODEL, m_unstructModel.get());

// Add properties
cee::PtrRef<cee::PropertySetCollection> propColl = new cee::PropertySetCollection;

cee::exp::PropertyBuilderPlot2d plotPropBuilder(propColl.get());

// Loop through all plots shown in view
for (size_t i = 0; i < view()->overlay().itemCount(); i++)
{
    cee::vis::OverlayItem* overlayItem = view()->overlay().item(i);
    cee::plt::OverlayPlot* overlayPlot = dynamic_cast<cee::plt::OverlayPlot*>(overlayItem);
    if (overlayPlot)
    {
        // A plot properties
        plotPropBuilder.addFromPlot2d(*overlayPlot);

        // Add plot data
        for (size_t j = 0; j < overlayPlot->curveCount(); j++)
        {
            std::vector<cee::Str> variableNames;
            std::vector<std::vector<double> > variableData;

            variableNames.push_back("X Values"); // Used in file only. Axis names are set as properties
            variableNames.push_back("Y Values"); // Used in file only. Axis names are set as properties

            cee::plt::Curve* curve = overlayPlot->curve(j);
            variableData.push_back(curve->xValues());
            variableData.push_back(curve->yValues());

            exporter.addPlotData(overlayPlot->title(), variableNames, variableData);
        }
    }
}

exporter.addProperties(*propColl);
exporter.saveCase(filename);
Tutorials
|
Plot2d: Create a simple overlay plot |
See the demo apps for example code
|
Location: Examples/Qt/QtDemoApp |
|
Location: Examples/WinForms/WinFormsDemoApp |
See also
