Color Interpolation
HOOPS Visualize Desktop supports the concept of color interpolation which can help convey information such as stress, pressure, airflow, altitude, etc… Color interpolation is supported on faces, vertices and edges for shells/meshes/cylinders, and may be smooth (normal color interpolation) or banded (color index interpolation). The HPS::ColorInterpolationControl is used to enable or disable color interpolation.
Normal color interpolation is achieved by:
- Using one of the
SetVertexRGB[variant]methods supported by theHPS::ShellKey,HPS::MeshKey, andHPS::CylinderKeyclasses, in order to set a color on vertices - Calling
HPS::ColorInterpolationControl::SetFaceColorto instruct HOOPS Visualize Desktop to interpolate the vertex colors across faces.
The following code sample shows how to set colors on vertices to get a color interpolation effect:
    mySegmentKey.GetColorInterpolationControl().SetFaceColor(true);

    HPS::SizeTArray vertexIndices(4);
    vertexIndices[0] = 0;
    vertexIndices[1] = 1;
    vertexIndices[2] = 2;
    vertexIndices[3] = 3;

    HPS::RGBColorArray colorArray(4);
    colorArray[0] = HPS::RGBColor(0.24f, 0.48f, 0.56f); // 1st vertex - blue
    colorArray[1] = HPS::RGBColor(0.67f, 0.07f, 0.64f); // 2nd vertex - purple
    colorArray[2] = HPS::RGBColor(1, 0.5f, 0); // 3rd vertex - orange
    colorArray[3] = HPS::RGBColor(0, 0, 0); // 4th vertex - black

    myShellKey.SetVertexRGBColorsByList(vertexIndices, colorArray);
mySegmentKey.GetColorInterpolationControl().SetFaceColor(true);

ulong[] vertexIndices = { 0, 1, 2, 3 };

RGBColor[] colorArray = { new HPS.RGBColor(0.24f, 0.48f, 0.56f),  // 1st vertex - blue
                          new HPS.RGBColor(0.67f, 0.07f, 0.64f),  // 2nd vertex - purple
                          new HPS.RGBColor(1, 0.5f, 0),           // 3rd vertex - orange
                          new HPS.RGBColor(0, 0, 0)               // 4th vertex - black
};

myShellKey.SetVertexRGBColorsByList(vertexIndices, colorArray);
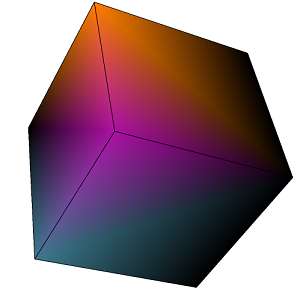
This code snippet would produce this type of interpolation
Color Index Interpolation
When color interpolation is used, individual colors typically have a specific value or range of values associated with them. For instance, if you want to show a topographical map with different colors representing different altitude, you would create a color map. In the rendering of the topographical map, you want to show color banding that corresponds to the color map.
Color Index interpolation is achieved by:
- Using one of the SetVertexIndexColor[variant] methods supported by the
HPS::ShellKey,HPS::MeshKey, andHPS::CylinderKeyclasses, in order to set colormap index colors on vertices - Calling
HPS::ColorInterpolationControl::SetFaceIndexto instruct HOOPS Visualize Desktop to interpolate across the colors in the colormap.
The following sample code and images demonstrate the effect of the various color interpolation settings. See our color interpolation sample for additional details.
    // enable color interpolation for faces
    mySegmentKey.GetColorInterpolationControl().SetFaceColor(true);

    // enable color index interpolation for faces
    mySegmentKey.GetColorInterpolationControl().SetFaceIndex(true);

    // enable color interpolation for edges
    mySegmentKey.GetColorInterpolationControl().SetEdgeColor(true);

    // enable color index interpolation for edges
    mySegmentKey.GetColorInterpolationControl().SetEdgeIndex(true);

    // enable color interpolation for vertices
    mySegmentKey.GetColorInterpolationControl().SetVertexColor(true);

    // enable color index interpolation for vertices
    mySegmentKey.GetColorInterpolationControl().SetVertexIndex(true);
// enable color interpolation for faces
mySegmentKey.GetColorInterpolationControl().SetFaceColor(true);

// enable color index interpolation for faces
mySegmentKey.GetColorInterpolationControl().SetFaceIndex(true);

// enable color interpolation for edges
mySegmentKey.GetColorInterpolationControl().SetEdgeColor(true);

// enable color index interpolation for edges
mySegmentKey.GetColorInterpolationControl().SetEdgeIndex(true);

// enable color interpolation for vertices
mySegmentKey.GetColorInterpolationControl().SetVertexColor(true);

// enable color index interpolation for vertices
mySegmentKey.GetColorInterpolationControl().SetVertexIndex(true);
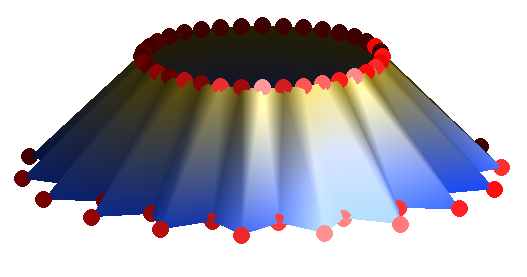
A shell rendered with color interpolation
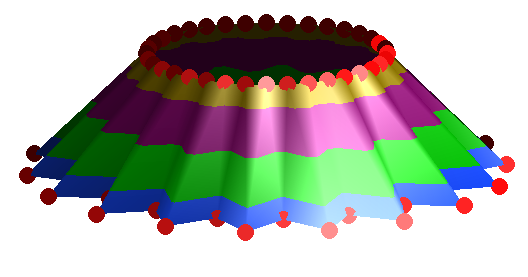
A shell rendered with color index interpolation
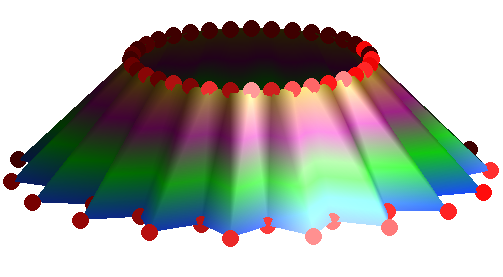
A shell rendered with both color interpolation and color index interpolation
Contour Lines
Contour lines are a special type of line which can delineate different regions on a shell or mesh. The classic use case for contour lines is to show topographic elevation on a map. Coupling this type of line with color bands gives the viewer a sense of varying altitudes at different locations.
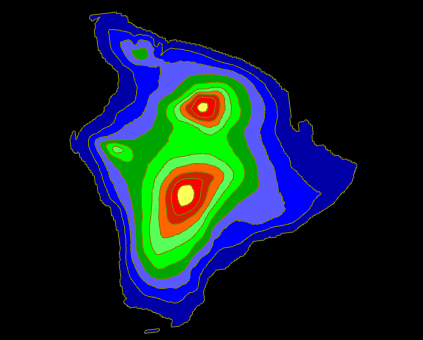
A topographic map with contour lines
Typically, a model like the one above is built out of a mesh. In HOOPS Visualize Desktop, contour lines are always associated with color bands - you can’t have contour lines without some kind of color data that delineates the boundaries of the band. You must define the colors using a material palette, then you (indirectly) define the contour boundaries by setting color on individual vertices in the mesh.
A topographic map is usually made out of a rectangular mesh. The z-values of each point are then altered to create the relief. You could then set the color of a particular vertex as a function of its height. After the colors are set, you can use the HPS::ContourLineControl to enable visibility as well as other attributes of the lines themselves:
    mySegmentKey.GetContourLineControl()
        .SetVisibility(true)
        .SetPositions(1.0f, 0.5f)
        .SetWeights(2.0f)
        .SetColors(HPS::RGBColor(1, 0, 0));
mySegmentKey.GetContourLineControl().SetVisibility(true)
    .SetPositions(1.0f, 0.5f).SetWeights(2.0f).SetColors(new RGBColor(1, 0, 0));
An important consideration when setting contour line attributes is HPS::ContourLineControl::SetPositions. This method allows fine control over where the lines appear as well as the interval between them. In the code example above, the interval is set to 1.0f. This means a contour line will be drawn between each color band. A value of 2.0f would mean a line would appear at every other band. The offset, 0.5f, means the contour line will be displaced by half a measure. This method works well if the lines are in a predictable pattern, but if you need to set the contour lines to appear at arbitrary positions, you should look into HPS::ContourLineControl::SetPositions(FloatArray). That variant allows you to set the contour lines at specific positions.