Rendering Clouds of Points: A Dynamic Point Splatting Example
With recent improvements in 3D scanning, rendering huge clouds of points is becoming a necessity. Indeed the default output primitive of the scanning sensors is the 3D point.
The topic of this book is to give hints to solve the major issues a user may encounter when developing a point cloud visualizing application. Like any other tutorial, this book is accompanied with its code section and its final HOOPS Luminate executable in order to illustrate the different topics.
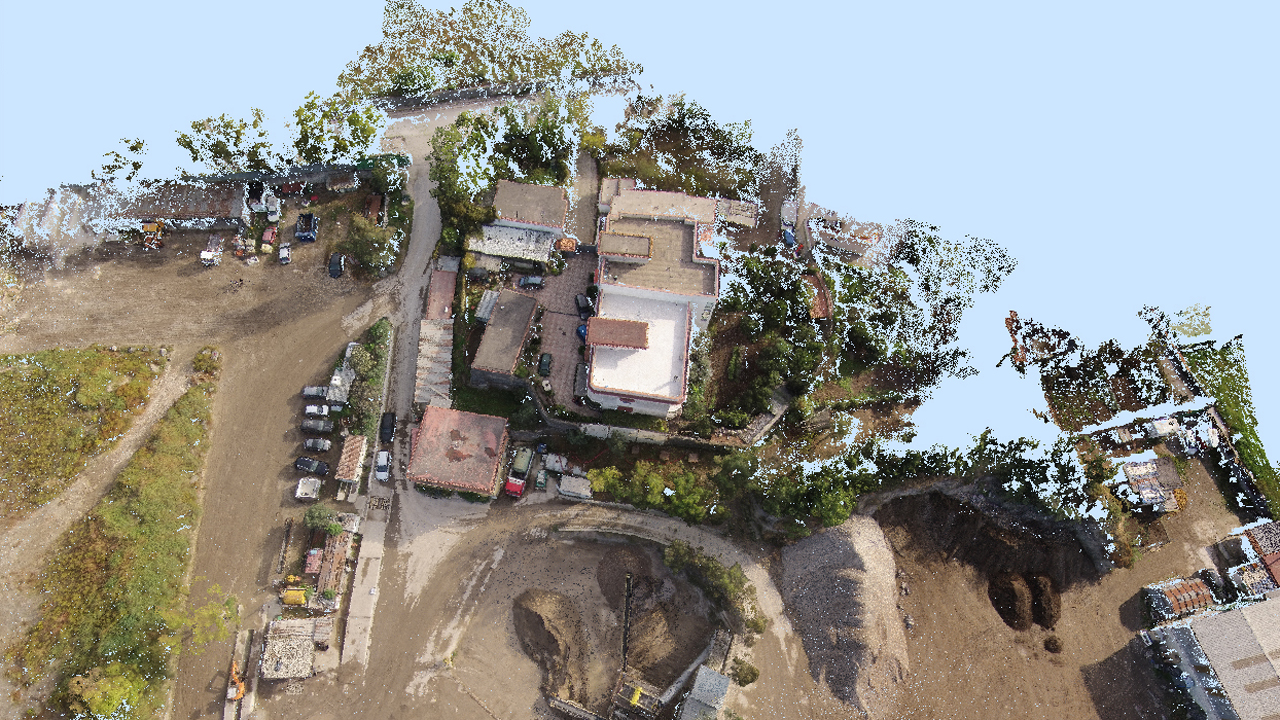
A default point cloud visualization
Of course HOOPS Luminate is already capable to render point clouds using the point shape primitive RED::IPointShape (as you can see in the basic tutorial Building Basic Primitives). The objective of the book is to find a better way to display them efficiently so that a user can zoom on the model and not lose the display quality.
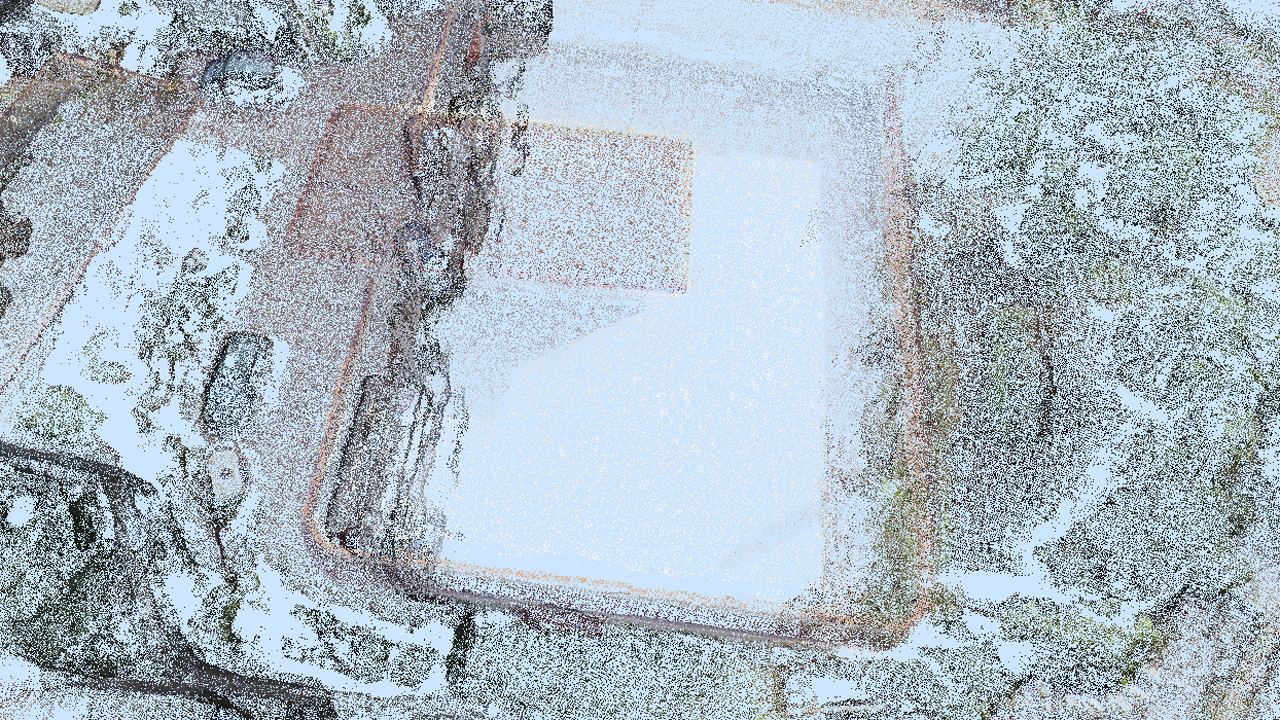
Zooming on point shapes
This book will try to address four major issues in the following pages:
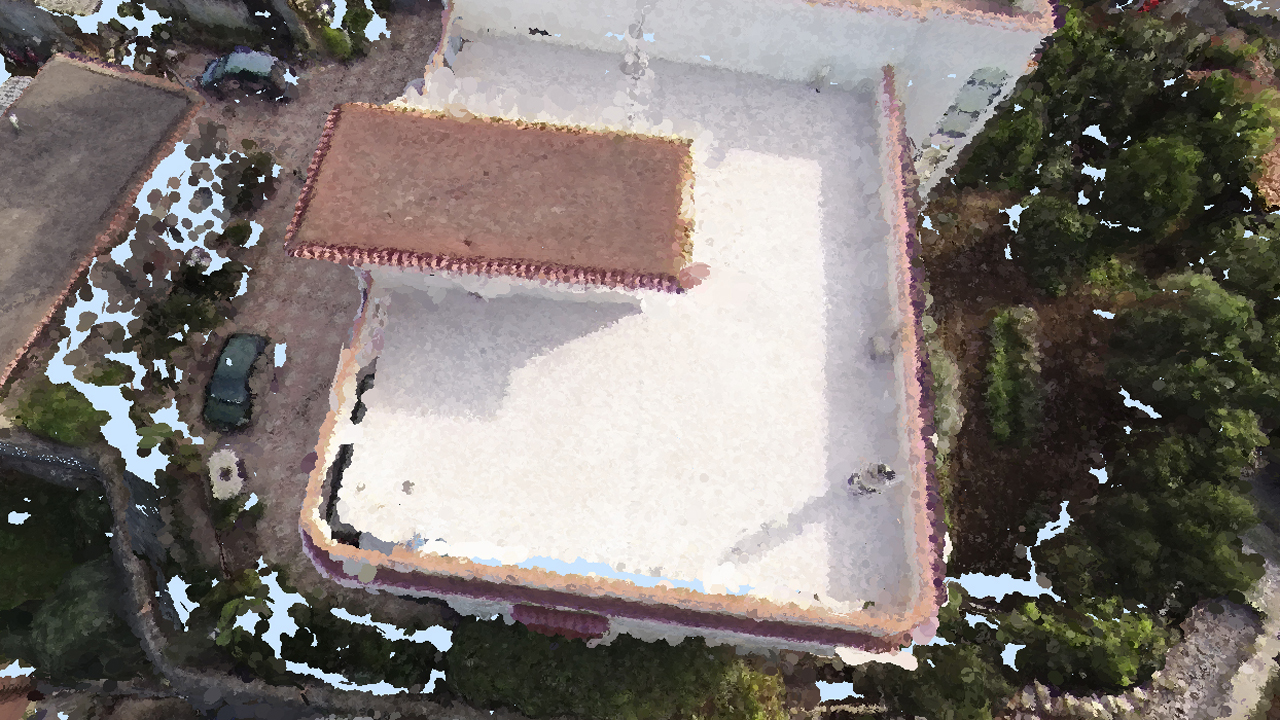
The point cloud visualization after the processing
The point clouds dataset used in this tutorial are the property of:
- Ing. Maria Danzi (http://www.geofotogrammetrica.it)
- Analyst group (http://www.analistgroup.it)