Rendering 2D Datasets
HOOPS Luminate is a hybrid 2D / 3D engine suitable for all types of rendering application, from real-time to photo-realism. Among the applications for which HOOPS Luminate is widely used are the 2D display applications.
Despite an appearance of simplicity, resulting of a lost z coordinate, the 2D world is very complex to handle, and require a careful data setup.
2D Data Organization for an Efficient Rendering
Most industrial 2D models are coming from the Autodesk(r) AutoCAD world and are saved as .DWG files. AutoCAD has a wide influence over this entire market segment of graphics and as a consequence, the AutoCAD data structure is what we have access to to create a visible representation.
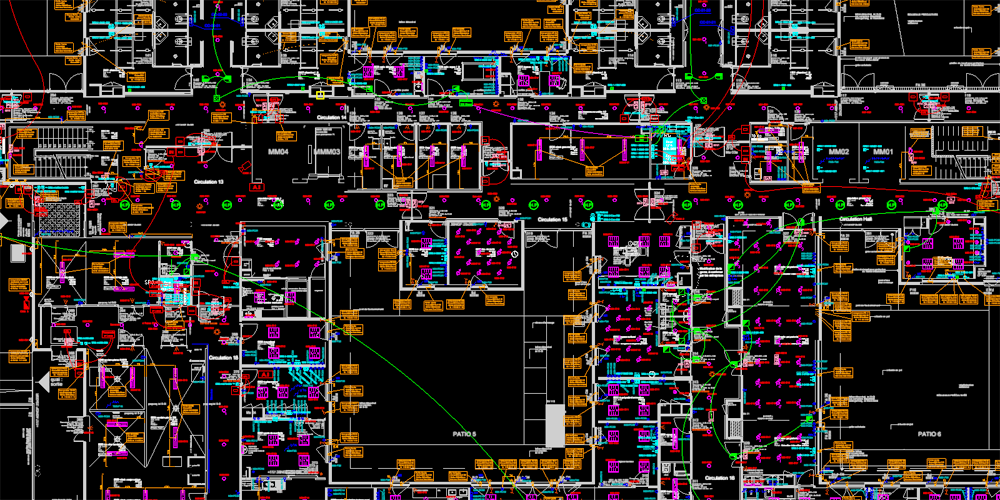
A large .DWG assembly
A very common situation is to have millions of objects in a scene. In most .DWG files, objects are very small and there are many of them in the model. Every text character, every line segment, every circle, rectangle, arrow, dashed line may exist in the model database as an isolated object.
The immediate consequence is that a ‘naive’ scene graph organization using one scene graph object for each model object will not render with optimal performances:
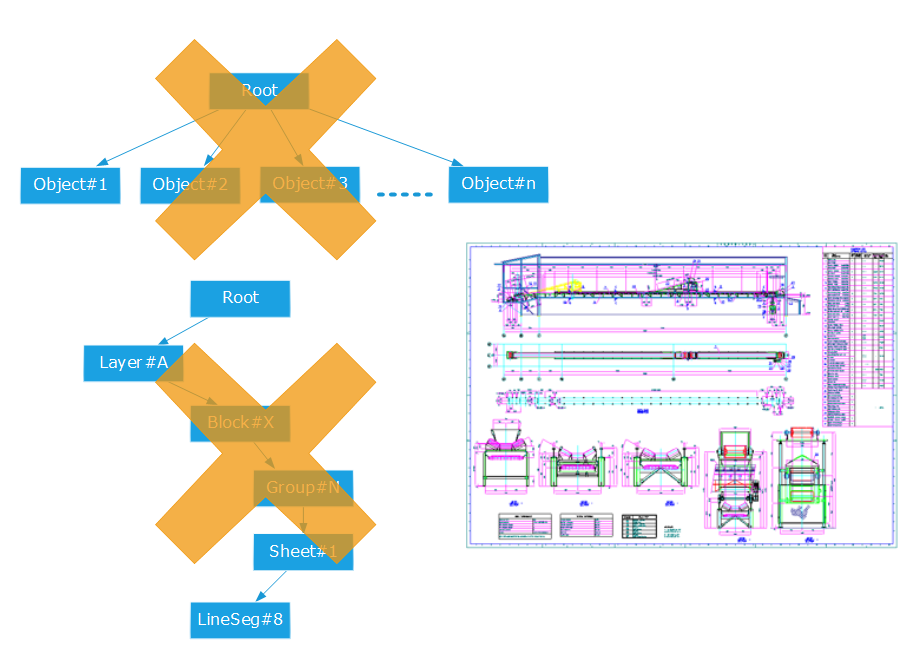
Let’s be crystal clear: don’t do that!
A rake based organisation if catastrophic. A deep tree organization is catastrophic either! Both will lead to bad rendering performances. Why? Simply because the engine will spend more time analyzing what it has to draw than really drawing data.
HOOPS Luminate’s scene graph is ‘heavy weight’: each shape has a lot of properties (see Shape Attributes in a Scene Graph for details): list of parents, children, materials, layersets, bounding spheres, callbacks, etc…Therefore each shape must be analyzed by HOOPS Luminate before it can be rendered. Parts of these analysis have to occur each frame as they depend on the observer position.
A good 2D data organization disconnects the model from the graphics. A deep tree organization usually sets the model semantics to be a bijection with the graphics organization: we have documents, so let’s put a root shape for a document; then we have layers, ok set a child shape for layers. Data are in groups? no problem, add a group shape…and so on: This doesn’t work well with 2D data. Note that we don’t say that it does not work. Actually it works, but performances are 10 times below what they should be!
So disconnecting the model semantics from the graphics mean that graphics entities to draw should be classified only by their graphic properties. In a 2D world this usually means that entities with the same color should be grouped together and added to the same shape. This way, the data organization is nearly optimal for the display performances.
But, then, what about selecting large groups of objects? erasing 100.000’s of lines and then pressing Ctrl+Z to undo? It can still work: because entities are small, accessing their graphic representations is not time consuming on today’s computers. Updating graphic representations dynamically is not an issue either as the GPU bus bandwidth is big enough to handle that.
We’re not telling that this is the only solution to an efficient data organization, but we found that using an approach that disconnects the model semantics from the graphics organization was much easier to implement and to maintain than using a one-to-one relationship. The bridge between the model and the graphics is then performed by a transformation function whose inputs are model events and whose outputs are graphics commands to perform.
A concrete example of such an architecture is implemented in the HOOPS Luminate bridge for Teigha here: DWG Import using Teigha.
2D Cameras
The setup of a 2D camera is easy. Basically it’s done using a viewpoint with the RED::VPT_ORTHOGRAPHIC projection model. HOOPS Luminate’s viewpoints have a built-in call to setup a ‘screen draw’ axis system. See RED::IViewpoint::SetForScreenDraw for details.
2D Visual Styles
2D shading is easy: there’s no shading. Ok. Done! However, 2D visual styles can be very complex: we mainly have to manage point styles, line styles and maintain a good line quality for the display. We’ll mainly use the RED::StateShader configuration to reach our objectives.
Using the GPU, a line can be drawn thin or thick. However, a line’s thickness can’t exceed a maximum value which is hardware dependent. Generally, this is 10 pixels. A line can be set thick using RED::StateShader::SetLineWidth. The state shader in which this action is performed needs to be rendered before the RED::RenderShader that’ll actually do the coloring of the line primitives:
Similarly, points can be drawn as small or large dots. By default point dots are squares. The size of a point is ruled by RED::StateShader::SetPointSize.
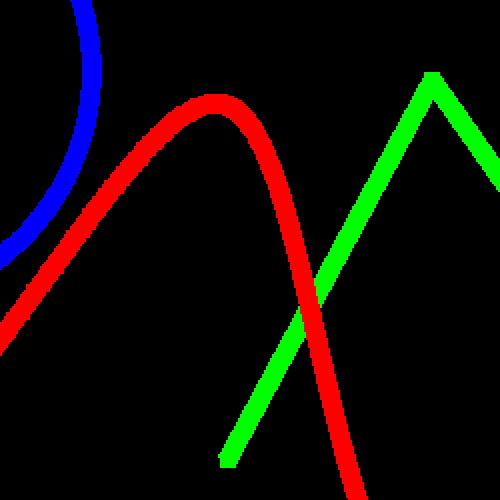
Line and points rendered with a thickness and size. No smoothing enabled.
For both points and lines, turning on the ‘smoothing’ option will change the shape of points (they become round) and add a smooth alpha fade-off that can be used to get a high quality rendering of the primitive if blending is enabled. The smoothing is enabled using RED::StateShader::SetLineSmoothing ( true ) and RED::StateShader::SetPointSmoothing ( true ).
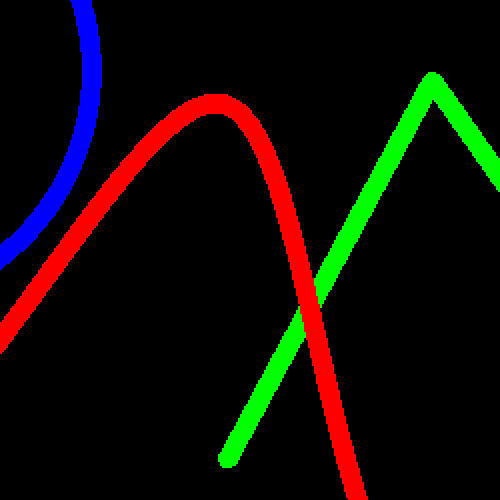
Same as above with smoothing enabled.
Then a RED::StateShader::ADDITIVE blending mode needs to be set:
Same as above with smoothing AND alpha blending enabled.
Then, to get above the hardware thickness cap, which may be mandatory for all paper space representations of lines, we’ll need to use another rendering technique based on textured quads and polygons to render thick lines with round endings. See the Rendering Any Line Thickness Using Quads tutorial dedicated to this topic.
Text Display
All HOOPS Luminate text display methods can work in a 2D environment. See the Text Shapes for details. However, visualization of large drawings may cause far away text display issues and also performance issues. RED::FNT_TRIANGLE texts may not be readable enough when seen from a far distance and they may take some time to render compared to the RED::FNT_TEXTURE type of texts.
Software Rendering of 2D Datasets
HOOPS Luminate’s ray-tracing engine can display meshes, points, lines and texts. Therefore, all the shapes that exist in a scene graph can be visualized in software. Nevertheless, there are still a few restrictions that apply as of HOOPS Luminate 4.0:
- Thick lines are displayed thin in software ray-tracing,
- Large points are displayed as simple dots in software ray-tracing.
RED::FNT_TEXTUREtexts are not filtered as they are in hardware accelerated rendering.
We hope to remove these limits very soon.

